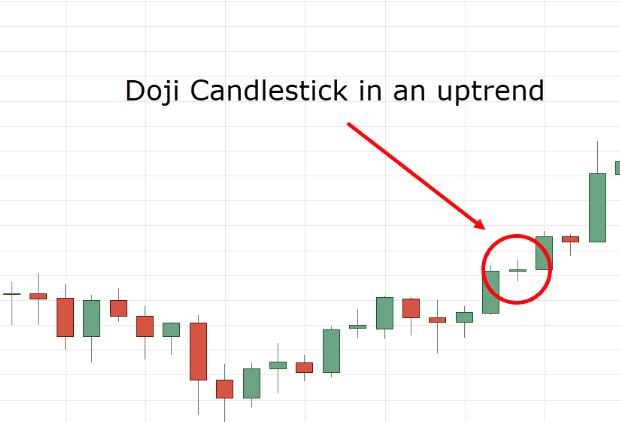
The Doji Candlestick Pattern: How to Trade It
Doji Candles are candlestick patterns used to analyze trend reversals on the market. To place successful forex trades, traders can examine past price movements using the Doji candlestick to forecast future prices. You can use Doji Candlestick patterns to confirm a potential high or low price point by comparing a currency pair’s open and close […]
The Doji Candlestick Pattern: How to Trade It Read More »