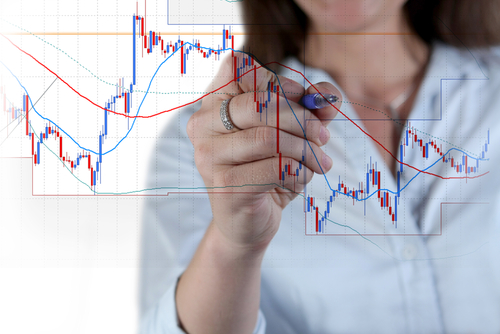
If we talk about the main purpose of Forex charts, these charts are generally used to depict the movement of currency prices as time passes. Thus, in forex trading, you will notice a constant change in currency prices with time.
For a smooth and hassle-free experience in forex trading, considering using forex charts is of great help. Forex charts are available in diverse types, and each has its functions in trading activity. Here we have a quick discussion about different types of forex charts and their main purpose:
There are three common types of forex charts, namely:
- Line Charts
- Bar Charts
- Candlestick charts
Let’s discuss each one of them in detail below:
1. Line charts
First, we have line charts which are used for highlighting the key features of any investment. Plus, these charts are also used for displaying the price of any investment over time.
With time, line charts are becoming extremely common for many companies to investigate their forex growth.
Line charts also have a trend line that describes the economic asset. This trend line often interprets certain areas, part of that chart. For example, a trend line is drawn when those areas are joined with few more technical indicators to display specific trading results.
2. Bar charts
The use of bar charts is quite common in financial analysis. These charts are widely used for predicting the future market trends in any foreign exchange.
In short, bar charts are the visual representation of any real-time currency price and its movement from one currency to another. Thus, a trader will generally find the use of bar charts during short-term trading or day trading.
In addition, bar charts also play a vital role in displaying the data for both short-term and long-term market trends. Therefore, to acquire better trading strategies, a trader can also play various bar charts.
3. Candlestick charts
Third, we have candlestick charts! The use of candlestick patterns is quite common in currency trading and technical analysis. For the last so many centuries, the use of candlestick charts has been popular enough to predict market behavior.
The use of candlestick patterns in Forex trading is extremely efficient and reliable, especially for new traders. Moreover, it enables the trader to start trading with little information and within low-risk settings.
We highly recommend using a candlestick chart compared to the rest of the two charts for several reasons. First, Candlestick charts are easy to understand and to read. Second, they even offer great clarity about price/currency action and predict the market trends.
Bottom line
Apart from the above three forex charts, various other charts are also available, which are helpful to use in trading at some stage. But for us, these three are the most common ones and effectively perform successful trading.
You should consult some advanced traders and see what trading charts they are using and why not others. Then, do a bit of research on each trading chart, know its pros/cons, and pick the one which suits your trading requirements. All the Best!


