As traders, we encounter various chart patterns, such as Double and Triple Tops and Rectangles.
The triangle trading pattern is also a chart pattern.
It is the most common chart pattern, so we must understand how it works.
What is a Triangle Chart Pattern?
The simplest way to describe this is a narrowing range of prices where fluctuations occur from one end to another.
The top and bottom of a particular price action converge like the edges of a triangle.
We can draw triangular boundaries along the two extremes
Us traders typically expect a breakout when these upper and lower levels interact.
We commonly use a triangle pattern to identify breakouts.
Although the triangle has existed for a long time, we need to identify the signs of narrowing in advance.
Do Triangles Work in Forex Trading?
Yes, they do.
This is because the market is very dynamic and constantly fluctuating.
Retracements are bound to occur, which ultimately form a triangle pattern.
Thus, triangle patterns are pervasive and give an essential indication to traders like us.
Types of Triangle Patterns and How They Work
Ascending Triangles
This type of triangle has a flat upper side, which is relatively horizontal.
The bottom is increasing, and the oscillations inside the triangle decrease. It has a bullish character.
Its flat upper side allows us to set entry points for long positions.
We can expect a trend to continue if the bullish trend is formed in an ascending triangle.
Descending Triangles
this is a mirror image of an ascending triangle.
The flat side is now below the price action, and the upper side has a downward inclination.
It has a strong bearish appearance.
Usually, we consider such triangles medium-term patterns. But they can be long-term as well.
Descending triangles open short positions after the lower flat side is broken.
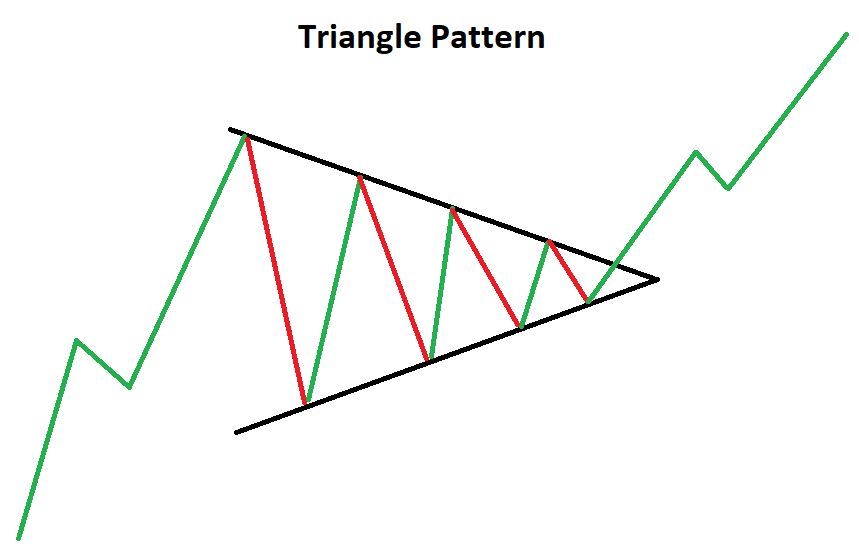
Symmetrical Triangles
Instead of depicting reversal, these triangles allow us to determine early movement.
The tops of the price action are lower, while the bottoms are higher. This is because the two sides of the triangle are also of the same angel, giving a symmetrical shape.
These can break at any point, up or down.
This is because the bullish or bearish movements have equal strengths.
A breakout is liable to cause a price movement equal to the size of the pattern. For this reason, we need to identify a breakout before it occurs in the upper or lower level.
After a breakout, we can expect corrective movements.
Expanding Triangle
Expanding triangles are unique in shape, which is why we can quickly identify them.
There is an inclination on both sides of the triangle in opposite directions.
It is difficult to predict price movement in case of a breakout.
Bottom Line
Triangle patterns are one of the most common trading charts in forex. Analysis of the slopes, inclinations, and fluctuations between the bulls and bears is vital in predicting the type of triangle and the price movement after a breakout.

