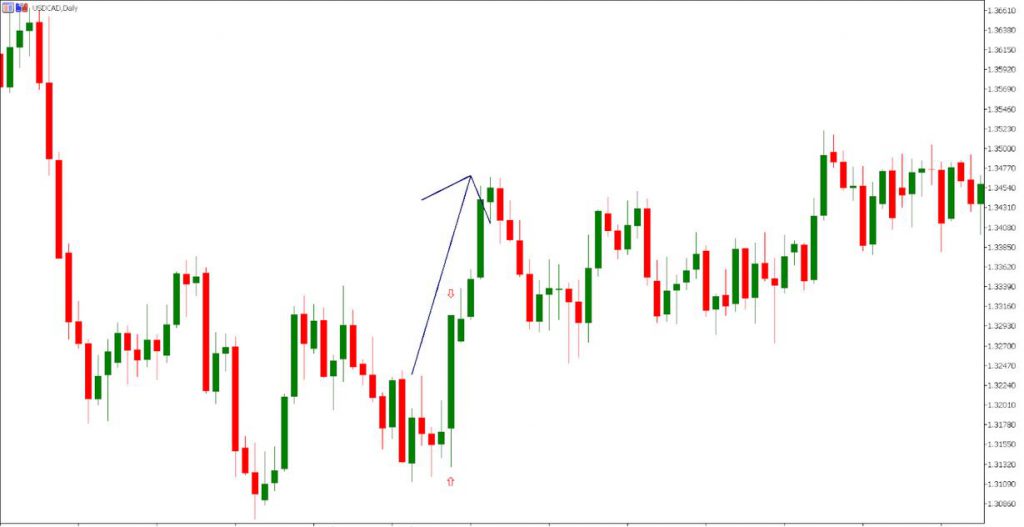
Kicking candlesticks are two-bar candlestick patterns that signal a reversal of current market trends. It indicates a sudden shift in the market. Kicking candlestick patterns often appear before or after market hours following a surprise event or news announcement.
The gap between the two candles is an important aspect of the kicking pattern. A kicking pattern is among the best and most influential trading patterns that cannot be ignored because it is one of the market’s strongest and most significant patterns.
Nonetheless, kicking candlestick patterns are very rare. Furthermore, traders do not change their opinion drastically about a stock as they do about the stock market. The kicking pattern appears in both bearish and bullish variants depending on the trend in which it appears.

The bearish kicking candlestick pattern
Bearish kicking is a candlestick pattern that will reverse the price trend by forming two opposite-colored candlesticks with a gap between them. Price charts usually include this pattern at the top of a resistance/supply level.
Using the bearish kicking candle, one can predict the onset of a bearish trend. It appears primarily on stock or index price charts. The candlestick can also act as a trend continuation indicator.
What does it tell traders?
Traders can use the bearish-kicking candlestick to predict a downward trend. Market bullishness is evident from the formation of the first candle. As the candle length increases, the bulls in the market gain strength.
Using the second candle, we can demonstrate that the uptrend has reversed into a downtrend, indicating the end of the uptrend. Double candles also indicate the occurrence of a major event that ultimately results in price drops.
As a result of the bearish enthusiasm, the prices are rapidly declining.
The bullish kicking candlestick pattern
Bullish kicking candlestick patterns are found during downtrends and signal upcoming bullish market reversals. Two candlesticks make up this chart. On the first day, we see a black Marubozu, while on the second day, we see a white Marubozu with an upward gap between them.
To successfully identify the bullish kicking pattern, we only need two Marubozu candles. Marubozu candles without any shadows are the only candles that should be used.
What does it tell traders?
In the context of trading, a bullish kicking pattern signals the beginning of a trend reversal. A candle in the first position indicates that a downward trend is currently prevailing in the market.
A major event occurs, which causes prices to rise, causing the second candle to gap up. Bullish enthusiasm makes the price move upward at a great pace. Bullish candles suddenly appear after bearish candles, with such a significant transition that they cause a gap between them.
How does the kicker pattern work?
Given the kicker pattern, traders may expect a pullback if the price moves too quickly. Some traders may wish they had taken positions when they initially identified the kicker pattern.
It is rare to see a kicker pattern, even though it is one of the strongest indicators of bull or bear sentiments. Overreacting rapidly is not common among professional traders. Nonetheless, money managers take notice of kicker patterns when they appear.
An analyst can use the kicker pattern as one of the most powerful signals. Markets that are overbought or oversold enhance their relevance. A two-candle pattern behind the pattern is visible.
Candles that open and move in the direction of current trends constitute routs, while candles that open simultaneously on the previous day (gap opening) qualify as reversals.
Many trading platforms display candles with opposite bodies, creating a colorful display of investor sentiment shifts. The kicker pattern only appears after a significant change in investor attitude, so it relates to behavioral finance or other measures of market psychology.

Bottom line
Traders should combine kicker candlesticks with technical analysis tools like moving averages. To make this candlestick more useful, you should backtest it before applying it live.


