Professional traders and brokers in the foreign exchange market use charts, graphs, and analysis tools to illustrate potential outcomes and recurring trends in day trading.
Among these instruments, a candlestick chart is relatively standard. Day traders frequently use candlestick patterns because they are both visually appealing and straightforward to interpret.
What is the definition of a candlestick pattern?
You can use Forex candlesticks to your advantage when forecasting the short-term direction of values. Because of this, they are an integral part of day trading tactics in the forex market.
Each candlestick in a standard Japanese chart denotes the day’s opening price, intraday high, intraday low, and ending price for a given currency pair.

For instance, a daily candlestick chart for EUR/USD would display the day’s high as the wick or shadow at the top of the candlestick. It also displays the day’s low as the wick or shadow at the bottom of the candlestick.
The open, high, low, and close values are required to construct a candlestick over a given time frame. A trader, for instance, would need to know the daily open, high, low, and close values to construct a daily candlestick.
The same event will happen in a weekly and monthly candlestick chart. The closing price of a session is required for a fair assessment of the candlestick.
Learn how to read candlestick patterns in forex trading
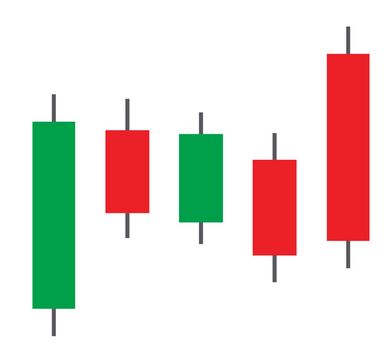
The candlestick’s body represents the price movement range between the day’s opening and closing values. Bearish and bullish candlesticks tend to be of distinct colors.
The candelabra itself is hollow, creating what we refer to as “shadows” in the vertical and horizontal planes.
If the body of a candlestick is colored (typically black or red), the closing price is lower than the starting price for the day.
When the body of a candlestick is clear (generally white or green), it indicates an increase in price from the previous day’s opening to ending levels.
Traders who keep an eye on exchange pairs can learn when a trend is changing, breaking out, or continuing, thanks to the reversal patterns revealed by candlestick analysis.
Traders can use this information to determine if they need to adjust their holdings, engage in short selling, or set additional stop-loss orders to safeguard their funds.
Technical analysis uses support lines drawn on candlestick charts to determine whether the foreign exchange market is moving up or down.
Which is the best candlestick pattern you can rely on?
In the eyes of various investors, various patterns are the most trustworthy. Some of the most prevalent are bullish and bearish engulfing lines, long-legged dojis, and baby tops and bottoms.

The most popular candlestick time frames for day investing are 5 and 15 minutes. There are four significant marks on candlesticks, often referred to as OHLC (open high low, close)
Bottom line
It would help if you had top-tier graphing tools to master candlestick trading and learn how to trade profitably. Many traders consider MetaTrader to be the finest trading platform available.

