A trading strategy must be able to interpret the market’s directional movement based on the trend so that it can be applied at the right time. This article aims to provide traders with an overview of the top 4 trend strength indicators that allow them to understand particular trends better.
Traders can take advantage of a strong trend to make high-profit trades at low risk. However, trades involving a weak trend may be high-risk. The lack of confidence in trading in a weak trend can also negatively affect a trader.

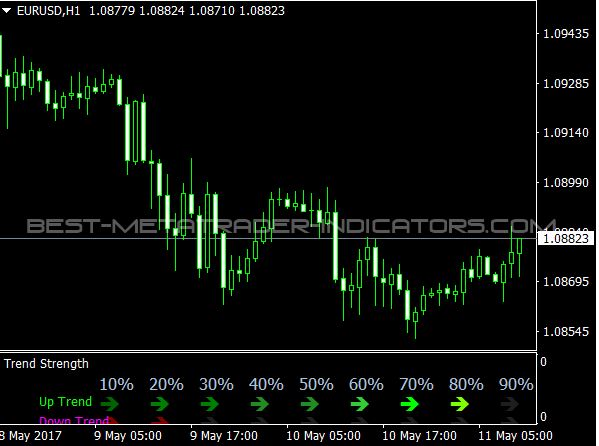
Average Directional Index (ADX)
ADX (Average Directional Movement Index) is an indicator of trend strength developed by Welles Wilder. A price range average can be derived by averaging values across expanding price ranges.
A trader typically uses it to gauge the overall strength of a trend. However, it needs to indicate the direction. The DMI + and DMI – provide a positive and negative indication of trend strength.
An ADX value above 25 generally indicates a strong trend. If it’s below 20, it suggests there’s no trend. Trends are usually ending when they decline from high values.
A low ADX value for a long period of time, followed by a high ADX value, probably signals the beginning of a trend.
ADX line direction is also crucial in determining trend strength. ADX lines that go up indicate that the trend strength is increasing. A rising line indicates a decreasing trend strength.
True Strength Index (TSI)
As a momentum oscillator, the True Strength Index (TSI) was developed by William Blau. The purpose of it is to smooth out price fluctuations. A price chart captures the flow and ebb of price action.
The TSI formula, as well as the double-smoothed price change, are used to smooth price changes. The first step calculates price change based on the 25-period moving average.
In the next step, the output price change for the previous 13-period EMA returns for double smoothing. After calculating the TSI value using the double-smoothed price change, it computes the TSI value by plugging the value into the TSI formula.
As a general rule, TSI signals an uptrend when it’s above 0. Overbought TSI indicates a downward trend
Rate of Change (ROC)
Rates of Change (ROCs) are pure momentum oscillators. As well as trend strength indicators, it is also widely used. As well as overbought and oversold conditions, the indicator shows oversold conditions.
It compares the current price with a specific earlier period and shows how it has changed. Furthermore, it varies above and below zero depending on the ROC value.
ROC is generally positive when it is above the zero line or the zero line. If ROC is negative or below zero, the price declines. A ROC’s value changes due to the difference between the current and earlier closing prices.
ROC = [(Today’s Closing Price – Closing Price n periods ago) / Closing Price n periods ago] x 100
McGinley Dynamic (MD)
John McGinley developed the McGinley Dynamic (MD) to smooth price movements and indicate trend strength. With this indicator, you can track the market better than SMAs and EMAs.
The moving average is smoother, more responsive, and more responsive to changes. Price whipsaws and price separation decrease as well. Adapting to market movements is automatic with its formula.

Here is the calculation:
McGinley Dynamic Indicator (MD) = MD1 + (Price – MD1) / (N * (Price / MD1) ^ 4)
MD1= value of the preceding period
- Price=Security’s current price
- N=number of periods
MDs are similar to moving averages. McGinley Dynamic is, therefore, a trend identifier similar to moving averages. Generally, a price higher than the MD line signifies an upward trend. In contrast, when the price drops below the MD line, it signifies a downward trend.
Bottom line
It can take time to determine which trend indicator is best. Indicators differ in their quality, but no one is better than the other. There are pros and cons to every indicator. Trading strategies and personal preferences should be taken into account when selecting indicators. Indicators frequently change by some traders, which can hinder their trading strategy. To become an expert at using trend indicators, traders should stick with one or two.

