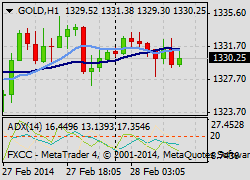
 Moving on in the series regarding the swing trading indicators that we favour using in our “is the trend still your friend?” weekly trend trading analysis articles we now come to the ADX…
One of the simplest indicators to use it’s not only much maligned, but also misunderstood and rarely used, or used correctly by traders. This is a shame because used correctly, particularly in tandem with other indicators such as the DMI, it can be a very powerful trading indicator and tool. Undoubtedly, similar to nearly all indicators bar price action, it lags as opposed to being a leading indicator. However, many traders would testify to their beliefs that the indicator does have predictive qualities, if used correctly and we stress the word ‘”if”. Traders can become easily confused with the low or high readings versus the slope and or changes in direction. It is important to remember that the ADX is essentially an indicator that highlights the trend strength of the particular security being traded; it doesn’t necessarily signal any trend direction.
Technical details and origins
The Average Directional Index (ADX), Minus Directional Indicator (-DI) and Plus Directional Indicator (+DI) represent a group of directional movement indicators that form a trading system developed by Welles Wilder. Wilder designed ADX with commodities and daily prices in mind, but these indicators can also be applied to FX and indices. The Average Directional Index (ADX) measures trend strength without regard to trend direction. The other two indicators, Plus Directional Indicator (+DI) and Minus Directional Indicator (-DI), complement ADX by defining trend direction. Used together, chartists can determine both the direction and strength of the trend.
The average directional movement index (ADX) was developed in 1978 by J. Welles Wilder as an indicator of trend strength in a series of prices of a financial instrument. ADX has become a widely used indicator for technical analysts, and is provided as a standard in collections of indicators offered by various trading platforms.
The ADX does not indicate trend direction or momentum, only trend strength. It is a lagging indicator; that is, a trend must have established itself before the ADX will generate a signal that a trend is under way. ADX will range between 0 and 100.
Generally, an ADX reading below 20 indicates trend weakness, and readings above 40 indicate trend strength. An extremely strong trend is indicated by readings above 50. Alternative interpretations have also been proposed and accepted among technical analysts. For example it has been shown how ADX is a reliable coincident indicator of classical chart pattern development, whereby ADX readings below 20 occur just prior to pattern breakouts.
Trading concepts
There are a lot of different systems that go into trading the ADX. Here are some strategies that we’re of the opinion have some potential.
1. There is a buy signal when the ADX peaks and starts to decline when the +DI is above the -DI. With this strategy we would sell when the ADX stops falling and goes flat.
2. When the ADX reading (14 day) on a daily time frame drops below 12 traders can begin to become alert and interested in the possibilities, when the ADX then drops to 10 or below 10 their interest can become intensified. ADX readings of 10 and lower are extremely rare, often not occurring in a given market in a calendar year. The ADX indicator is a kind of “compression” reading. Low ADX readings indicate that a pattern congestion has stored a tremendous amount of potential energy. This extremely low reading is an indication that the period of consolidation is likely to end. When combined with other classical charting patterns and price action, the ADX can be very powerful. An ADX set up occurs when the daily or longer chart pattern is completed just following a period with an ADX at 10 or lower.


