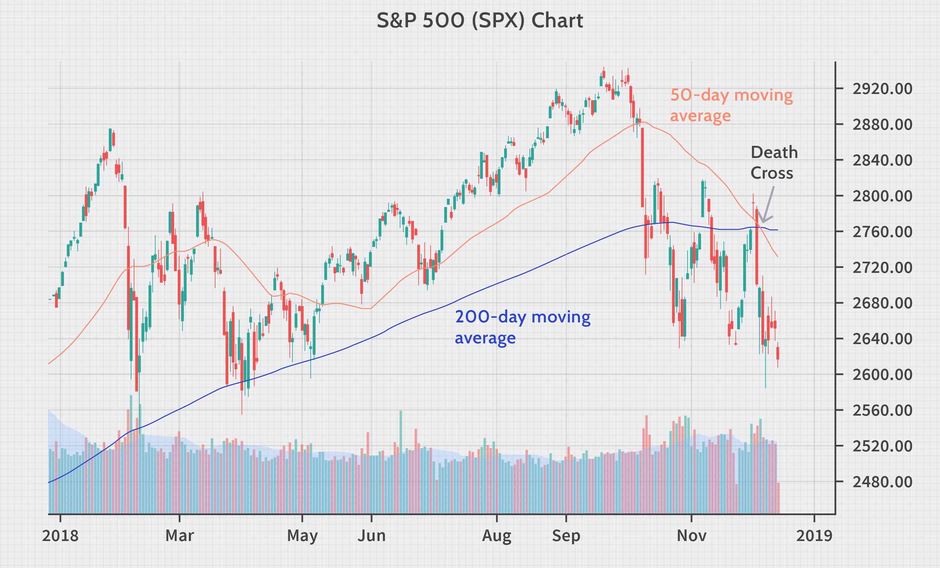
The death cross is a technical pattern that signals the end of a bull market and the beginning of a bear market. When a short-term moving average (50-day) passes below a long-term moving average, it is known as the Death Cross (200-day).
The X-shape generated when the short-term moving average falls below the long-term moving average is known as the death cross.
The Death Cross has shown to be a reasonable analysis of the world’s most severe market downturns, including 1929, 1938, 1974, and 2008.
What is the Death Cross?
When an asset’s short-term moving average, generally the 50-day, crosses below its long-term moving average, usually the 200-day, the Death Cross appears on the chart.
The pattern has previously appeared after a drop in long-term and short-term moving averages. The Death Cross indicates that momentum is weakening in the short term.
How to recognize the Death Cross?
The Death Cross is defined by some traders as a crossover of the 100-day and 30-day moving averages, while others define it as a crossover of the 200-day and 50-day moving averages.
Traders sometimes look for crossovers on shorter-term charts as an indication of a strong and continuing trend.
The Golden Cross is the opposite of the Death Cross. When the short-term moving average rises above the long-term moving average, it becomes visible.
How to apply the Death Cross trading strategy?
When used in conjunction with other technical and fundamental analysis, the Death Cross pattern is more valuable to traders.
Trading volume is one of the most often used technical indicators for demonstrating a long-term trend shift. A major trend change is caused by increased trading volume, implying that more investors are buying or selling.
It is considered a more trustworthy indication if the Death Cross happens in combination with significant trade volumes.
Trend confirmation may also be done with momentum oscillators like the MACD. Because the momentum of a long-term trend frequently goes away before the market turns, they did well.
Smaller periods, such as the 5-period and 15-period moving averages, are widely used by day traders to trade intra-day Death Cross breakouts.
The chart’s time interval can be changed from 1 minute to a week or month. The Death Cross signals are stronger and remain longer when the chart timeframe is greater.
Because the Death Cross pattern is frequently a lagging indication, some traders don’t put too much faith in it.
It’s possible that the downward moving average crossing won’t materialize until the trend has turned from bullish to negative. Before the crossing death signal, the price of an asset may have already dropped significantly.
The Death Cross is a powerful bearish pattern that gives entry and exit possibilities. The Death Cross should be used in conjunction with other technical indicators to increase its effectiveness.
Because it’s a bearish pattern, it solely delivers sell indications. Traders, on the other hand, can exit long positions whenever the Death Cross appears.
Bottom line
The Death Cross predicted many previous market crashes. This demonstrates that the pattern can predict trend shifts. However, no indication is perfect. Thus the Death Cross should be used in conjunction with other technical indicators.

