The Golden Cross is a candlestick chart pattern that gives a bullish signal. When a short-term moving average crosses above a long-term moving average, it is called a crossover.
What is the Golden Cross?
The Golden Cross is a bullish pattern. It is formed from a crossover of short-term moving averages like 9-day and a long-term moving average like 200-day.
When a short-term moving average goes above the longer one, we have a Golden Cross. It predicts a bullish market since long-term indicators are more effective.
How to recognize Golden Cross?
A Golden Cross has three stages that traders must recognize. They are as follows:
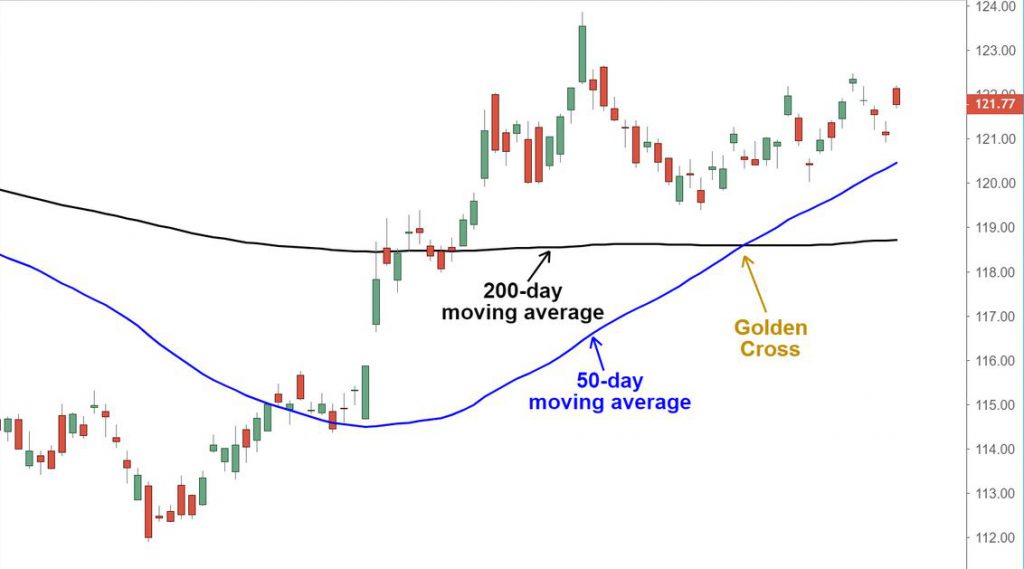
1. First, a downtrend develops at the short-term moving average, which crosses below the long-term trend before the moving averages crossing.
2. A new trend emerges in the second stage, also known as the intersection, in which the short-term moving average overtakes the long-term moving average.
3. Finally, the uptrend must continue, with prices being supported by the short-term downtrend moving average.
The inverse of Golden Cross is the death cross, and it occurs when a short-term MA goes below the longer one.
How to apply the Golden Cross trading strategy?
The 50-period (short-term) and 200-period (long-term) moving averages are the most often applied moving averages for the Golden Cross. The period denotes a certain period. Therefore, longer durations of time usually result in greater breakouts.
The weekly 50-day moving average crossing of any forex pair up through the 200-day moving average, for example, is a powerful bullish signal.
Intra-day golden cross breakouts are typically traded by day traders or intra-day traders using shorter periods such as the 9-period and 15-period moving averages. You may choose the period from 1 minute to week or month. In the same way that longer periods generate stronger breakouts, chart periods do as well.
The golden cross breakout will be more sharp and long-lasting the longer the chart time frame is.
As with any technical indicator, the possibility of functioning with a certain forex pair or other assets does not ensure that it will work on another.
The Golden Cross has the disadvantage of being a lagging indicator. Historical data does not reflect the predictive capacity to foretell future price swings. As a result, it’s usually combined with other technical indicators.
Traders can use the Golden cross breakout signals with a range of momentum oscillators, such as stochastic, RSI (relative strength index), and MACD (moving average convergence divergence), to determine whether a bullish trend is overbought or oversold. This aids in the identification of precise entry and exit positions.
The Golden Cross is useful for long-term and short-term traders, depending on how moving averages are used. As previously said, it is best to combine the Golden Cross with other technical analysis to improve trading techniques. Because the pattern is bullish, only buy signals are generated.
Bottom line
The Golden Cross is a powerful bullish pattern that provides entry and exit options. Golden Cross should be used in conjunction with other technical indicators to maximize its effectiveness.

