The ABCD is a Harmonic pattern that indicates the possibility of a reversal.
H.M. Gartley found the pattern and published it in his book “Profits in the Stock Market.” Scott Carney worked on the ABCD pattern afterward.
What is the ABCD pattern?
Like every other Gartley pattern, the ABCD pattern’s structure is dependent on formation. When the line AB equals the line CD, the pattern emerges. Legs are defined as lines AB and CD, while correction or retracement is defined as line BC.
Each part of the pattern resembles Fibonacci numbers and symbolizes short-term trend reversal. Traders use the Fibonacci technique to discover the pattern on the chart.
Connecting highs and lows establishes the pattern between points A, B, C, and D.
How to identify the pattern?
Three rules determine the ABCD pattern’s validity. These are the following:
- For the pattern to appear, the price must go from point A to point B, then from point C to point D.
- The distance between A and B and C and D must be equal, and the line BC must show a 61.8 percent to 78.6 percent retracement of AB. In addition, the CD should indicate a 127.2 percent to 161.8 percent extension.
- The CD leg should be a 127.2 percent to 161.8 percent extension of the AB leg.
The ABCD pattern is frequently confused with the Three-Drive pattern by traders. Both patterns have a similar structure, but the Three-Drive contains three legs known as drives (A, B, and C).
How to apply the ABCD pattern strategy?
In a downturn, the bullish pattern appears and predicts a possible reversal.
In an uptrend, the bearish ABCD pattern indicates a downward price movement.
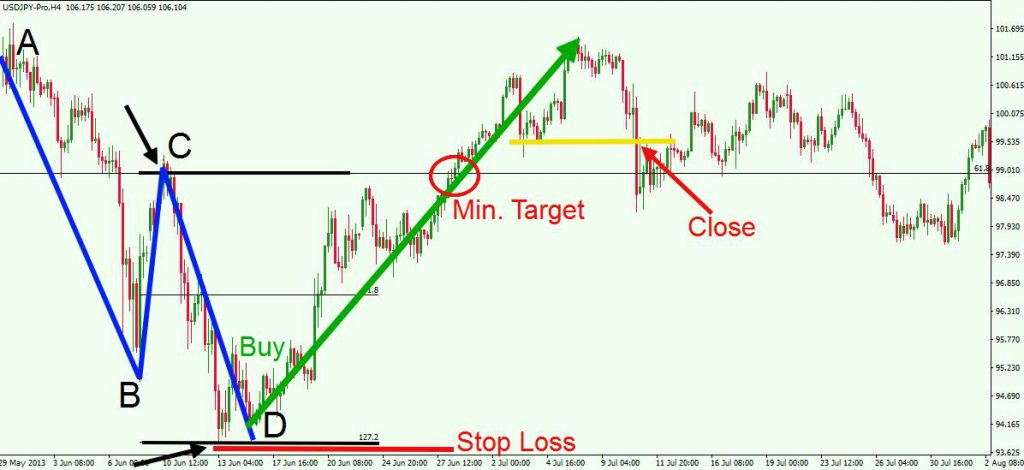
Traders wait for the pattern to finish before going long or short at point D to take positions. Traders purchase at D in the bullish version and sell at D in the bearish version.
Stop-losses are placed above and below point D. A cautious trader, on the other hand, can take positions after point D.
When trading the ABCD pattern, traders search for the highs and lows because of its overall structure. Combining the pattern with the zig-zag indicator is also a good approach to trade it.
Traders can quickly detect the ABCD pattern because of the indicator’s ability to depict price highs and lows.
The ABCD pattern is effective in trending markets, but it can be misleading in range markets. It is because traders often confuse price highs and lows for the ABCD pattern without confirming its authenticity. As a result, in range markets, the use of momentum oscillators is helpful.
Every timeframe is compatible with the ABCD. Short-term traders look for potential reversals on daily or weekly charts and use them in their trading strategies.
The longer the timeframe, the better would be the emergence of the ABCD pattern.
Bottom line
The ABCD is a basic Harmonic pattern that is instantly recognizable. Traders should pay attention to the guidelines to confirm the pattern and avoid combining it with price highs and lows.

