The harami is a simple candlestick chart pattern suggesting a trend reversal. Harami is a Japanese term that means “pregnant,” which is how the pattern appears.
What is a harami pattern?
The Harami pattern is made up of two candlesticks. The first candlestick stands at a considerable height. The second candlestick is much smaller than the first. This is because the second candle’s body must be confined or absorbed by the first candle’s body. Perfectly, the second candle would be less than half the size of the first.
This is where the idea of a pregnant woman comes into play: she would be the first (large) candle, and her baby would be the second (smaller) candle embodied inside the first.
A harami cross is a Japanese candlestick pattern in which a large candlestick moves in the trend’s direction, followed by a small doji candlestick.
The harami cross is different from the usual bullish and bearish harami patterns.
Types of harami pattern
There are two types of harami patterns: bullish and bearish.
The bullish harami pattern is made up of two candles, with the first bearish candle engulfing the second bullish candle completely.
It means that the first candle’s high is higher than the second candle’s high, and the first candle’s low is likewise lower than the second candle’s low.
Similarly, the first candle’s initial price is higher than the second candle’s closing price, and the first candle’s closing price is lower than the second candle’s opening price.
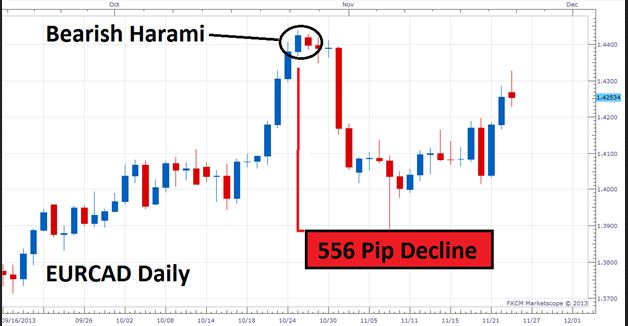
The bearish harami pattern comprises two candles, the first of which is surrounding the second.
It signifies that the first candle’s high is higher than the second candle’s high, and the first candle’s low is likewise lower than the second candle’s low.
Similarly, the first candle’s closing price is higher than the second candle’s opening price, and the first candle’s opening price is lower than the second candle’s closing price.
How to apply the harami pattern trading strategy?
A trader may enter the pattern at the second candle (harami candle) to take short positions.
A trader can set a stop-loss limit just below the bottom of the harami candle, which is ideal for traders who don’t have time to monitor the market or place a market order at the break.
Depending on the trader’s risk appetite, a stop-loss order might be set above either the harami candle’s peak or the lengthy bullish candle. Profit targets can be defined using areas of support and resistance.
On the other hand, a trader can take long positions at the pattern’s second candle (harami candle).
A trader can set a stop-loss order just above the crest of the harami candle. For instance, a stop-loss order might be put below the harami candle’s low or the long bearish candle’s high. Then, profit targets are set using support and resistance.
Bottom line
Harami patterns are useful for finding price reversals. Traders can also use technical indicators, such as the RSI or Stochastics, for further confirmation.

