
After spending some time in the market, you have probably realized that the markets quickly consolidate after a trend.
However, few people can answer the question of when to re-enter the trend.
The ABCD pattern is shaped like a lightning bolt. It consists of 3 separate moves with specific Fibonacci ratios that help identify potential reversal areas so you can move back in the direction of the main trend.
The AB = CD pattern is simple enough if you know how to spot it and draw Fibonacci retracement levels correctly.
AB = CD is a price structure adapted from another technical analysis model known as the Gartley pattern.
Structure of AB=CD
This structure consists of three segments, which are clearly visible on the chart.
- A to B.
- B to C.
- C to D.
Each part has a Fibonacci sequence that confirms the movement and completion of a short-term consolidation against the main trend.
Below are the Fibonacci ratios for determining the completeness of the AB = CD pattern
- For C, this is 0.382 (the rarest variant), 0.500, 0.618 or 0.764 of the AB segment correction.
- D is characterized by Fibonacci extensions 1.27 or 1.618 from the segment AB; the figure ends at this point.
Naturally, the pattern can be ” Bullish ” (which means ” Buy at point D “) and ” Bearish ” (which means ” Sell at point D “). Below are these off-chart patterns to give you a better understanding of the Fibonacci ratios.
Classic AB = CD Model
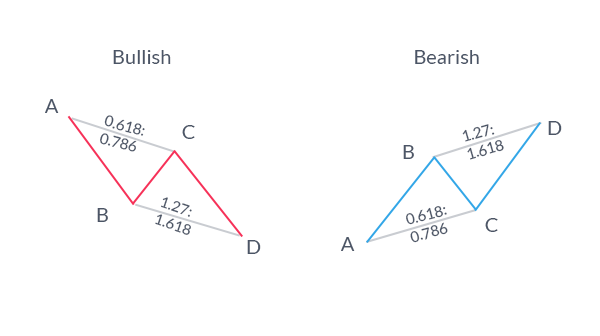
Important note: for the pattern to be valid, point C cannot go beyond the beginning line of the pattern.
Naturally, we are looking for the BC segment to end at one of the possible Fibonacci retracement levels. As soon as this level is confirmed, we start looking for point D.
The CD leg should be equal to the 1.27 or 1.618 Fibonacci extensions of the BC leg length.
You can also take the length of segment AB to see how far the segment CD goes because the AB = CD model gets its name. After all, its two parts are often reflections of each other in distance and time.
Determining the profit target after the formation of the AB = CD model
After all the above-described pattern coefficients match, you can set a stop loss below or above the confirmed point D.
After that, you can wait for the price to return back to point A, or at least set a profit target for half or two-thirds of the entire length of the movement AB = CD.
AB = CD is a simple yet powerful model.
As you can see, it has a lot of moving parts. However, when you learn how to define and measure them, you have a powerful way to reverse the trend after consolidation.
Bottom line
The article concludes that it is best to trade this pattern in the direction of the main trend.
To determine the main trend, you can use the Ichimoku Cloud or Moving Averages.
Also, do not try to enter until the pattern is complete. In other words, you better wait until the AB = CD pattern is fully formed rather than trying to trade in the hope that it will form.
Good luck with your trading!

