The actual average range, or the ATR, is a technical analysis indicator introduced by market technician J. Welles Wilder Jr.
A volatility indicator shows how much an asset moves on average during a given time frame. When the traders want to initiate a trade, the hand helps day traders confirm. In addition, it can find the stop-loss order.
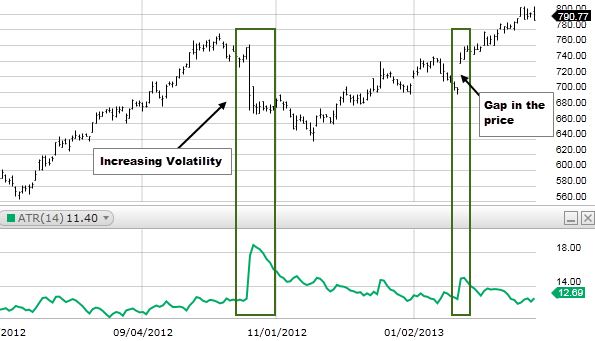
The ATR indicator moves up and down along with the price, depending on the asset’s movement. Therefore, a new reading is calculated as each period passes.
Calculating ATR
We calculate a new ATR reading every minute on a one-minute chart. Looking at a daily chart, we estimate a new ATR every day. The plot all these readings to form a continuous line. In this way, the traders can see and monitor the volatility.
If you want to calculate the ATR by hand, it is essential that we first calculate a series of true ranges (TRs). These are as follows:
- Current high minus the previous close
- Current low minus the previous close
- Recent high minus the current low
ATR trading strategy
Whether the number is a positive or a negative, it does not matter. The highest value will always be the answer.
First, the values for each period will be recorded. The next step is to take the average. In most cases, the number of periods used in one calculation is 14.
J. Welles Wilder, Jr., the man behind the ATR, used a specific formula for subsequent periods—after the initial 14-period ATR was completed. This process smoothened the data
Day traders can use this information to see how it moves in a specific period to plot profit targets and determine whether to attempt a trade or wait it out.
ATR example
Let us assume that a stock moves $1 a day, on average. So there is no real significant news that has come out, but the stock price is already up to $1.20 on that day.
The trading range, or the high minus low, is $1.35, and the price has already moved 35% more than the average. Therefore, you will get a buy signal from the strategy. The buy signal may be valid.
But since the price has already moved significantly more than average, betting that it will continue to go up may not be the best decision.
We know that the price is already increasing and has moved more than the average. That’s why the price is more likely to fall and stay within the price range that has already been established.
Once the price is near the top of the daily range and the content is well beyond average, it is an excellent time to buy. Selling is probably a good option, provided that a good sell signal occurs.
We should only base the entries and the exits on the ATR. It is a tool that should be used to help in filtering trades.
Bottom line
There is no doubt that the ATR is a valuable tool. It helps traders’ measure volatility and can provide entry and exit locations.
There could be an entire trading system based on just this one idea. However, there are two main limitations to using the ATR indicator. The first is that ATR is a subjective measure. It means that it is open to interpretation. Secondly, the ATR only measures volatility and not the direction of an asset’s price.

