Fibonacci analysis is a strategy in forex that can improve forex performance for a short and long-term position. Traders use them in identifying key price levels. These price levels show hidden support and resistance.
Fibonacci, used with other forms of technical analysis, builds a robust foundation for strategies that would perform well through many market conditions and volatility levels, which is the need in trading.
What is the Fibonacci sequence?
Each number in the Fibonacci sequence is calculated by adding the two previous numbers together. The significant thing to know about the pattern is that the ratio of any number to the next one in the sequence tends to be 1.618.
The value:1.618 is called Phi or the “Golden Ratio.”
The difference between each number is approximately 1.618 times. It is 1.618 times greater than the previous number. It is a mystery, but the Golden Ration frequently appears in the natural world, architecture, fine art, and biology.
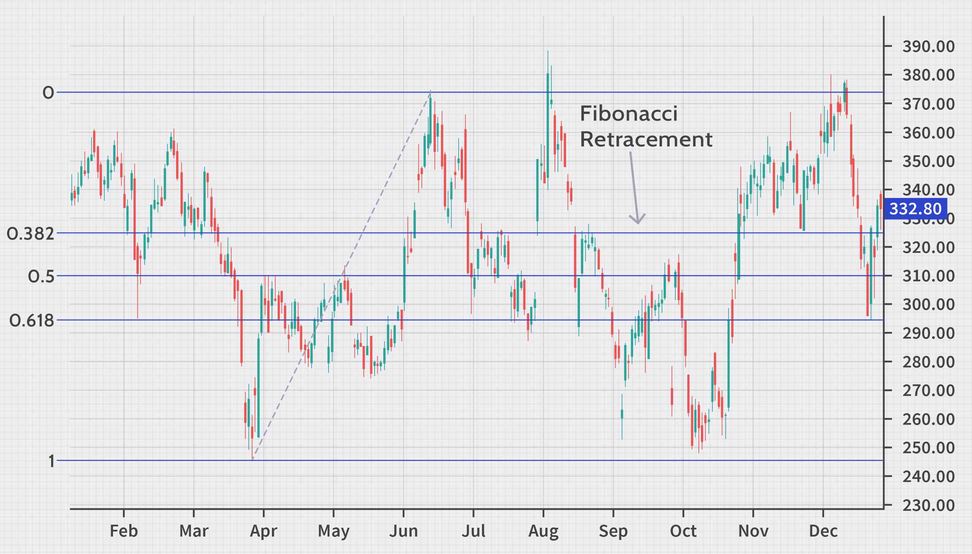
How Fibonacci retracement works?
These levels are also known as retracement levels when it comes to trading. This is because traders wait for prices to approach certain Fibonacci levels, and then they act according to their strategy.
Before opening their positions, the traders look for a reversal signal on these widely watched retracement levels. The most commonly used of these three levels is the 0.618 – the inverse of the golden ratio (1.618), denoted in mathematics by the Greek letter φ.
Drawing Fibonacci retracement levels is a simple three-step process:
In an uptrend:
- Step 1 – Identify the direction of the market: uptrend
- Step 2 – Attach the Fibonacci retracement tool on the bottom and drag it to the right, all the way to the top
- Step 3 – Monitor the three potential support levels: 0.236, 0.382 and 0.618
In a downtrend:
- Step 1 – Identify the direction of the market: downtrend
- Step 2 – Attach the Fibonacci retracement tool on the top and drag it to the right, all the way to the bottom
- Step 3 – Monitor the three potential resistance levels: 0.236, 0.382 and 0.618
Fibonacci Retracement Levels as Trading Strategy
The Fibonacci retracements are often used as part of a trend-trading strategy. In such a scenario, traders observe a retracement taking place within a trend and try to make low-risk entries toward the initial movement using Fibonacci levels.
Traders use the strategy to expect that there is a high probability of the price bouncing from the Fibonacci levels back in the direction of the initial trend.
Fibonacci retracement levels are used on many different financial instruments. These include stocks, commodities, and foreign currency exchanges.
They are also used on multiple timeframes. But as with other technical indicators, the predictive value is proportional to the time frame used, with greater weight given to longer timeframes.
For example, a 38.2% retracement on a weekly chart is a far more crucial technical level than a 38.2% retracement on a five-minute chart.
Bottom Line
Fibonacci levels are best used as a tool within a broader strategy. Ideally, this strategy looks for the confluence of several indicators to identify potential reversal areas offering low-risk, high-potential-reward trade entries.

