Divergence can be defined as a leading indicator utilized by analysts at FX Leaders to help in increasing profits.
The likelihood of entering the market in the right direction, and that too at the right time, increases if used with other indicators such as Moving Averages (MA), RSI, Stochastics, or various support and resistance levels.
Divergence in the forex world occurs when an asset moves in the opposite direction to a technical indicator. In most cases, a momentum oscillator or relative strength indicator.
When trading currencies, Forex divergence is typically seen as a sign that the current price direction is weakening and losing momentum, resulting in a possible change of direction.
What Is Divergence Trading strategy?
Even if we simply acknowledge the term “divergence,” anyone can quickly tell that divergence trading is a type of trading that has its roots in disharmony or deviation. As a result, currency traders around the globe frequently apply divergence forex trading strategies.
In theory, prices and indicators should go in the same direction at equal rates. If the price goes up, the indicator should get a higher high. If the price reaches a lower high, the indicator should follow it. The same principle applies to lower lows and higher lows.
If the price and the associated indicators don’t correlate, you can tell that some kind of change is about to occur. In short, divergence is calculated between highs and lows of price and the indicators. The best indicators for divergence trading are Stochastics, RSI, MACD, and Trade Volume.
There are two types of divergence:
- Regular
- Hidden
What is a regular divergence?
A regular divergence is used as a sign for trend reversal, and there are two types of regular divergences: bullish and bearish.
Regular Bullish Divergence
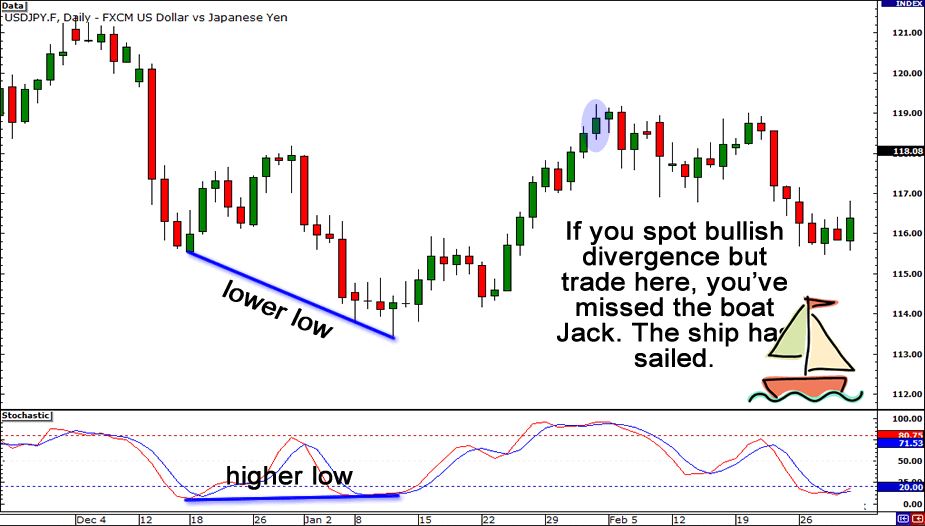
If the price is making lower lows, and at the same time, the oscillator is making higher lows, this is considered regular bullish divergence.
It usually occurs at the end of a downtrend.
Regular Bearish Divergence
If the price is making a higher high, but the oscillator is lower, this would be called a regular bearish divergence.
Such divergence can be found in an UPTREND.
What is a hidden divergence?
Divergences do not just signal a potential trend reversal but can also be used as a sign for a trend continuation. Therefore, the price continues to move in its current direction.
Hidden Bullish Divergence
Hidden bullish divergence happens when the price makes a higher low, and the oscillator shows a lower low side by side.
It can be seen when the pair is in an uptrend.
Once the price makes a higher low, you need to check and see if the oscillator is doing the same.
If that is not the case and makes a lower low, we have some hidden divergence in our hands.
Hidden Bearish Divergence
Lastly, we’ve got hidden bearish divergence.
It can occur when the price makes a lower high, but the oscillator makes a higher high.
By now, you’ve probably guessed that this occurs in a downtrend.
Regular divergences = signal possible trend reversal
Hidden divergences = signal possible trend continuation
Bottom line
The most helpful way to use a momentum indicator is to know what strategy to use. Of course, the price will lead the way, but momentum can indicate a time to preserve profits. The skill of a professional trader lies in their ability to implement the correct strategy for price action.

