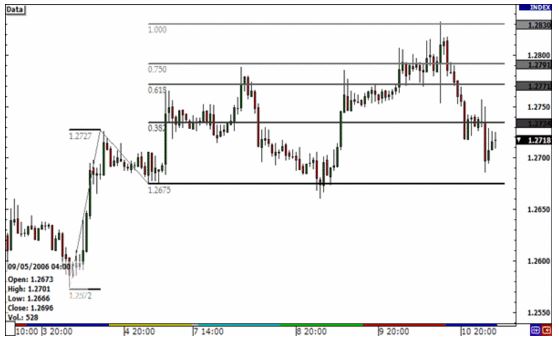
After a pullback, Fibonacci extensions can be used to estimate how far a price may continue to move after setting profit targets. There is also a possibility of price reversals at extension levels.
They are based on Fibonacci ratios (as percentages) and represent connections to points on a chart. 61.8%, 100%, 161.8%, 200%, and 261.8% are common Fibonacci extension levels.

Creating Fibonacci extensions
Fibonacci ratios are everywhere, including galaxy formations, architecture, shells, hurricanes, and plants. There is also some speculation that these common ratios may be significant in financial markets.
The Fibonacci extension does not have a formula. Indicators apply to charts by choosing three points. A move starts at the first point, ends at the second point, and ends at the third point.
By extending the price, we can then project where it may go in the future. Using the three chosen points, lines appear at percentages of each move. On a chart, extensions mark possible price levels. A Fibonacci ratio (as a percentage) is used along with the size of the price move to determine these levels.
What do Fibonacci Eetensions tell you?
The Fibonacci extension is a method of establishing price targets or finding projected areas of support and resistance when other methods of determining support and resistance are not applicable or obvious.
Prices may move to the next extension level if they move through one level. However, Fibonacci extensions are potentially interesting. Price may not reverse or stop at the level, but the area around the level may be crucial. The price might move just past, or just shy of, the 1.618 level before changing direction.
Long-term traders can use Fibonacci extension levels to determine where a stock may go after it reaches a new high. A short-term trader faces the same challenges. A trader can determine where to place profit targets by calculating Fibonacci extension levels. The position can be closed if the trader chooses to cover the position at that level.
Any market or timeframe can use Fibonacci extensions. Fibonacci clusters indicate a significant price area for stock and traders when making decisions.
Considering that extensions can be drawn on various waves of prices over time when multiple levels of these waves converge at the same price, that may be a very useful indicator.
Retracements and extensions of Fibonacci
Fibonacci retracement levels help to determine how deep a retracement could be, and extensions show where a retracement might lead. A Fibonacci retracement measures a trend’s pullbacks, whereas a Fibonacci extension measures its impulse waves.
Limitations of using Fibonacci extensions
A stock’s Fibonacci extension should not be used to determine whether to buy or sell it. A price target should be determined with the help of extensions and other indicators or patterns. To determine if a stock is likely to reverse at the target price, candlestick patterns and price action are particularly informative.
An extension level does not guarantee that the price will reach or reverse. The Fibonacci extension level that will be important only sometimes appears before a trade takes place. Price may not reach any of these levels or even move through many of them easily.

Bottom line
Traders believe Fibonacci ratios also have significance in financial markets because they appear in everyday life. A formula does not exist for Fibonacci extensions. On the chart, they mark three price levels of possible significance. Following a pullback, Fibonacci extensions indicate how far prices may move next. There are six common Fibonacci extension levels based on Fibonacci ratios: 61.8%, 100%, 161.8%, 200%, and 261.8%. The extension level can signal important areas but shouldn’t be relied on exclusively.


