When you know what you are looking for, you can use harmonic patterns to spot new trading opportunities and pricing trends. Check out this article to learn about the top harmonic patterns and how to apply them effectively.
What are harmonic patterns?
The harmonic pattern is a chart pattern that is part of a trading strategy. It can help traders predict future market movements by spotting pricing trends. Fibonacci numbers use geometric price patterns to identify potential price changes or trend reversals. These patterns are useful for traders in determining their next trading move.

Depending on the chart pattern, you can spot a different type of trend. There are several chart patterns to choose from. Having confidence in your abilities to perform your technical analysis before following any pattern. You will always be in a position to make the best – and the quickest – trading decisions.
The ABCD pattern
ABCD (or AB=CD) has three movements, and four points, often considered the easiest pattern. As a first step, there are sudden movements (AB), then corrective movements (BC), and then another sudden movement (DC) that follows AB’s path.
To reach precisely 0.618, retrace BC at the same rate as the AB leg. If the CD line is the same length as the AB line, then going from A to B will take the same time as going from C to D. The D point can serve as an entry point for long or short positions, or traders may wait until the entire pattern is complete before entering long or short.
The BAT pattern
As the name implies, the BAT pattern has a bat-shaped end product. Scott Carney identified the BAT pattern in 2001, composed of distinct elements that indicate PRZs. In this pattern, there is one more leg than in ABCD and one extra point, X. Following the first leg (XA), we will see a BC retracement movement. BAT patterns appear when the retracement between XA and B stops at 50% of the initial XA movement.
There is a minimum CD extension requirement of 1.618 and a maximum extension of 2.618. For the figure to be valid, there must be a minimum difference between CD and BC. A bullish price reversal or a bearish price inversion can happen before the endpoint (D), which creates the PRZ.
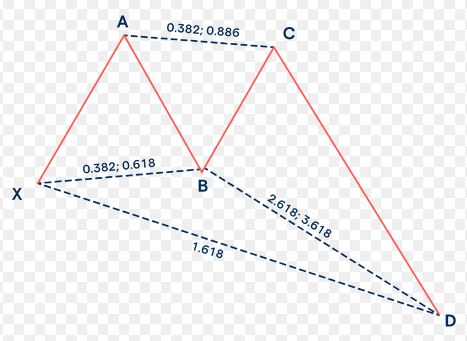
The crab pattern
In this Scott Carney-discovered pattern, traders can enter the market at extreme highs or lows by following the X-A, A-B, B-C and C-D patterns. XA movement extends beyond 1.618, defining the PRZ, which is the most important feature of the crab pattern.
Whenever the price rises sharply from point X to point A in the bullish version of the Crab, the first leg forms, and a 38.2% to 61.8% retracement appears on the AB leg from XA. A projection of BC (2.618 – 3.14 – 3.618) occurs to confirm the potential reversal of the current trend, identifying a good area for the completion of the pattern. During a bearish crab pattern, prices will dip between points X and A, then rise modestly, fall slightly, and rise rapidly to point D.

Bottom line
The dynamic nature of foreign exchange markets makes harmonic patterns particularly appealing to forex traders. Based on historical data, they can advise traders when underlying conditions indicate that a price drop is likely. The use of harmonic patterns by traders helps them predict market movements in the future. A trader can take either a bullish or a bearish approach. If bearish harmonic patterns are present, the market may be heading for a downturn. Harmonic patterns that indicate an upturn in the market are bullish.

