The stochastic oscillator is also called the stochastic indicator. It is a popular way to tell when a trend will likely change direction.
Thus, the indicator looks at how prices move and can be used to spot when stocks, indexes, currencies, and other financial assets are overvalued or oversold.

How does the stochastic indicator work?
The indicator compares the current price of an item to its range of highs and lows over a certain amount of time.
The indicator determines when prices will change by comparing the closing price to how prices have changed.
The stochastic indicator can be added to any chart with two lines, but it is not compulsory. It keeps going back and forth between zero and one hundred.
The indicator displays how the current price compares to its highest and lowest points over a certain period. The previous period was based on 14 individual periods. On a weekly chart, this would be the same as 14 weeks. In terms of hours, that’s 14 hours.
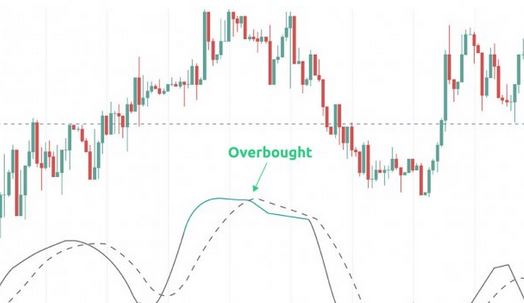
A white line will appear at the bottom of the picture when the stochastic indicator is used. The %K is visible through the white line. A red line shows the chart’s 3-period moving average of %K. This is also called %D.
- When the stochastic indicator is high, the price of the underlying object starts trading near the top of its 14-period range. When the level of the indicator is low, it means that the price just closed below the 14-period moving average.
- When the market is going up, the stochastic sign shows that prices usually end the day near their highest point. But when a market falls, prices tend to settle at their lowest point. Momentum loses steam when the ending price differs from the high or low.
- You can spot too high or too low numbers with the stochastic indicator.
- Price changes must be slow or spread widely for the indicator to work.
How can you read the stochastic oscillator?
The stochastic oscillator will display the recent prices in a range starting from 0 to 100. 0 is the lowest price, and 100 is the highest in recent years.
As the stochastic gauge level reaches above 80, the asset starts to trade near the top of the range. And when the level is below 20, the asset starts to trade near the bottom of the range.

Limitations
The oscillator’s main problem is that it sometimes gives wrong information. This happens when the indicator gives a trading warning, but the price doesn’t respond.
When the market is unpredictable, this happens a lot. You can use the direction of the price trend as a filter to figure out which signs to use for this reason.
Bottom line
The stochastic indicator is useful for economic research, especially when looking for instruments bought or sold too much. With the help of other indicators, the stochastic indicator can help find reversals in direction, support and resistance levels, and possible entry and exit points.

