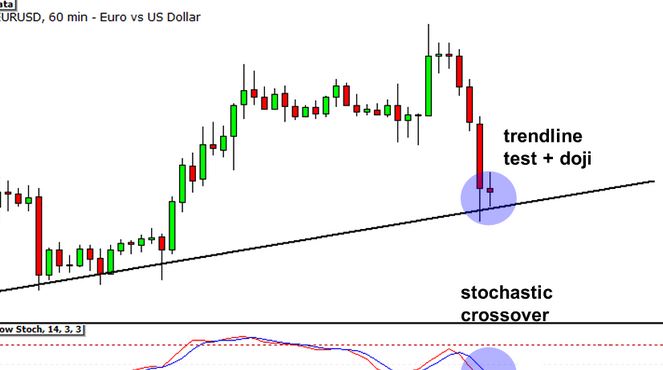
When trading, looking at the big picture by analyzing data from multiple time frames can be helpful. Traders can use this method to figure out the overall trend while using a more petite time frame to find good entry points.
Thus, traders can use technical analysis across multiple time frames to back up or disprove their trading bias, depending on which time frames they choose to look at first.

Introduction: Forex Multi time frame strategy
In the Multiple Time Frame trading technique, one currency pair is watched over more than the one-time frame. Looking at the chart’s highs and lows, you can see the overall and short-term trends.
But if you look at data more than once, you can find changes and trends you wouldn’t have seen otherwise.
Check out charts with candlesticks for 15, 30, and 1 hour. These time frames are considered medium. This is because the trader has enough time to study the market before moving but not so much time that he can’t make a profit in a relatively short time.
How can you trade multiple time frame alignments in forex?
When trading in foreign exchange, looking at how a single commodity or currency pair has done over several different time frames can be helpful.
Before getting a currency pair, you have to wait for at least two or three different times to go in the same direction. If the one-hour chart doesn’t match the longer-term charts, don’t trade.
Even though there is no hard and fast limit to the number of time frames that can be used, most dealers use a general rule of thumb when using Multiple Time Frame analysis.
The first step to successfully using Multiple Time Frames Alignment in the Forex market is to figure out what kind of trader you are. After that, you can set an asset or currency pair’s watch time.
Most of the time, you only need to look at three time periods to get all the information. This will help you to make a powerful trading decision and carry it out.
How to trade multiple time frames?
Traders often start by choosing an extended period and a “tick-by-tick” period. When trading on more than the one-time frame, many Forex traders use a 1:4 or 1:6 ratio. They use it with a four- or six-hour chart as the longer interval and a one-hour chart as the shorter one.
Use the longer time frame to find a pattern. Go for the shorter time frame to find the best market entry times. If researchers add a third, intermediate time frame, they will learn more about how the market works.

Bottom line
To sum up, traders on the foreign exchange market often use a technical analysis method called “Trading Multiple Time Frames Alignment.”
This method lets traders keep an eye on multiple charts of the same asset simultaneously to trade in the direction of the primary trend.
Multiple Time Frame analysis is helpful for Forex trading based on supply and demand. This is because it lets you figure out which side of the curve is in control (buyers or sellers), find profitable supply-and-demand zones, and choose the best entry points.


