Technical analysis and fundamental analysis are probably terms you are already familiar with. This matter falls into two major categories and several subcategories. The Forex multiple time frame analysis (MTFA) techniques is a great example of such a subcategory.
It can serve as a great supporting tool for traders. Most traders sometimes need to pay more attention to this analytical approach. This article aims to help you understand what multiple timeframe analysis is in Forex and how you can master it to improve your trading results.

What is Forex time frame analysis?
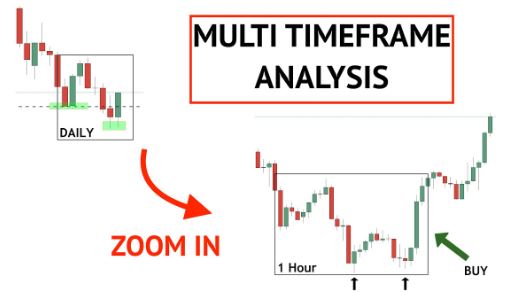
Multi-time frame analysis is a way to build a more comprehensive and effective trading plan for Forex by comparing data from various periods. Traders compare and structure information about trends, directions, and momentum based on the various time frame charts for the same currency pair.
Comparing a set number of frames is optional to get the best results. However, the general rule is that if you are at the low level and only compare two frames, you won’t get a very informative report, and you will probably miss what MTFA is all about.
The noise of too many timeframes can make the analysis results clear if you compare too many.
Those trying multi-timeframe analysis on Forex should start with three frames: short-term, medium-term, and long-term. How can we choose the right MTFA timeframes?
Choosing the right periods for Forex time frame analysis
In light of our previous conclusion that three charts are sufficient for comprehensive analysis, we now must decide which specific time setting to use in these frames. This is how the rule of four works, and it often refers to as the rule of four:
Start by selecting a medium-term or middle-term timeframe. Your trading style will heavily influence this. In this way, a day trader could set the period for an hour, while a long-term position trader could use a week or even a month.
You can determine the short-term frame by dividing the medium time set by four. Day traders will focus on the short-term timeframe of fifteen minutes (a quarter of an hour), while position traders will focus on the short-term of roughly one week.
Multiplying the medium value as a starting point by four to determine the long-term value. It follows that an hour turns four hours and a month into four months if we follow this logic.
The medium-term setting is very important because short-term traders will not care about a four-month chart, while long-term traders will need clarification on the fifteen-minute chart.
Trends in MTFA
The price of a security moves continuously in one direction on a market chart. Bullish trends are those that move upward, while bearish trends are those that move downward. Technical indicators – add-ons designed specifically for trading platforms – are the best way to identify trends.
To confirm the trend, neither switching between different time frames nor using the other set of indicators may confirm it. Choosing the right indicators is key, and relying on their results is the basis for your analysis and your trading strategy.

Bottom line
Specifically, the concept of multiple-frame analysis can seem daunting and complex to new traders. It’s a reasonable assumption since currency trading involves many complex aspects and requires some knowledge and experience.
It’s always a good idea to try out a strategy or technique several times to see how it works once you get the idea. Many traders apply the analysis results to the real market and trade small amounts according to the analysis results. Although it can be effective, if you apply the rules of MTFA incorrectly, your assets are still at risk. Practising your analysis skills in a demo account is the best solution.

