A Gartley pattern is a form of a Harmonic pattern that relies on Fibonacci numbers and ratios.
H.M. Gartley presented the pattern in 1932. The Gartley is also known as the 222 patterns, as stated on page 222 of the book by H.M. Gartley.
The Fibonacci numbers were not initially used in the Gartley pattern, but Larry Pesavento eventually included them in his book “Fibonacci Ratios with Pattern Recognition.”
What is the Gartley pattern?
The Gartley pattern, like any other Harmonic pattern, describes price highs and lows.
The Gartley employs Fibonacci numbers and ratios to pinpoint the trend’s direction and price points. Fibonacci is a number sequence formed by adding the previous two numbers together (0, 1, 1, 2, 3, 5, 8, 13). These numbers define price breakouts and retracements, as well as the levels of support and resistance.
How to identify the pattern?
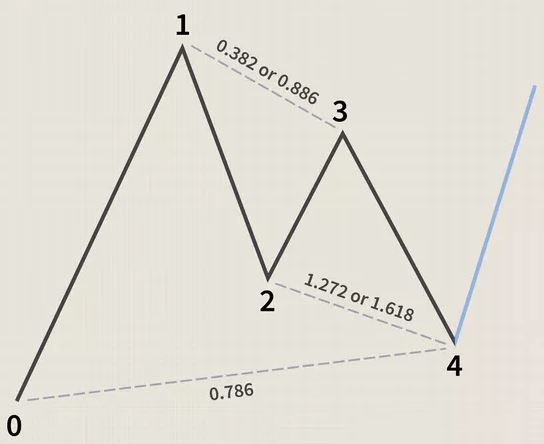
The pattern appears as you walk from X to A. Then, there’s a transition from point A to point B. The Fibonacci numbers come into play here. The ratio of 61.8 percent is equal to the distance between A and B and X and B. Following that, the price swings from B to C, with a 38.2 percent retracement.
The ratio of the distance between A and C is 88.6 %. The price then moves from C to D, with a 127.2 percent ratio. The distance between points B and D is 161.8 percent. Finally, the pattern ends at point D, with a distance of 78.6 percent between X and D.
The Fibonacci sequence is used to calculate these ratios. Divide the number in the sequence by the number to its right to get 61.8 %. 13/22, for example, equals 0.619.
How to apply the Gartley pattern in a strategy?
The Gartley can be used in both bullish and bearish forms.
In a downtrend, the bullish Gartley emerges and predicts a possible reversal. The design resembles an M in the alphabet.
In an uptrend, the bearish Gartley appears, signaling a price reversal. The pattern appears to be W.
To enter a Gartley trade, first, identify the pattern and then double-check its validity. To plot the Gartley pattern on your chart, first, draw a circle around the four price swings and confirm that they respond to their respective Fibonacci levels.
Note the letter X, A, B, C, and D that corresponds to each price action swing. You’ll be able to judge the pattern’s overall size and have a good notion of the parameters this way.
It’s important to remember that you must wait for confirmation of a trend reversal before entering a trade. It is because the Gartley pattern might occasionally provide erroneous signals.
To tackle this problem, momentum oscillators or other forms of technical analysis should be used.
The Gartley pattern may be applied to any era. However, looking for the Gartley pattern on longer periods, such as weekly or monthly charts, is the best approach to spot it since it produces fewer false signals.
Bottom line
The Gartley is a simple Harmonic pattern. Therefore, it’s best to combine the Gartley with other technical analysis to get the most out of it.

