A moving average is a form of daily technical analysis that uses an updated average price to filter out price data. The average is calculated over a certain period, such as a year, 20 days, or one week.
What do Moving Averages tell us?
The use of a moving average can help to filter out market noise. A trader can predict price movement by looking at the direction of the moving average.
If the MA is pointing upwards, the price is rising, and if it is pointing downwards, the price is falling. In addition, if the MA moves sideways, the price ranges.
Moving averages can operate as support and resistance levels, which is one of its key advantages. For example, a 10-day, 100-day, or 200-day moving average may operate as a support level during an uptrend, indicating that the price will likely bounce higher.
On the other hand, a moving average can act as resistance and signal price decline during a downtrend.
Types of Moving Averages for the strategy
There are two main forms of moving averages:
- Simple Moving Averages (SMA)
- Exponential Moving Averages (EMA)
The SMA is calculated by multiplying recent closing prices by a predetermined time. A five-day SMA, for example, is determined by adding the five most recent closing prices and dividing them by five.
The EMA is not as straightforward to calculate as the SMA. This is because the EMA gives recent prices more weight. Due to the greater weight on recent prices, a 20-day EMA will respond swiftly to price movements compared to a 20-day SMA.
This does not, however, imply that EMA is superior to SMA. The EMA may perform better in some scenarios or markets, while the SMA may perform better in others. It all depends on the timeframe chosen.
Moving Average crossover strategy
One of the most used moving average strategies is crossovers. Traders can use crossovers in several ways.
The price crossover is the first type. When the price passes above or below the moving average, it appears. If the price crosses above, it indicates an uptrend; if the price crosses below, it indicates a decline.
Another crossover method is to use two moving averages, one shorter and one longer, at the same time. The trader’s choice determines the length of these moving averages.
An uptrend is indicated when a shorter moving average crosses above the longer MA. The golden cross is another name for this. When the shorter MA crosses below, the longer one, it suggests a downtrend. It is also called the death cross.
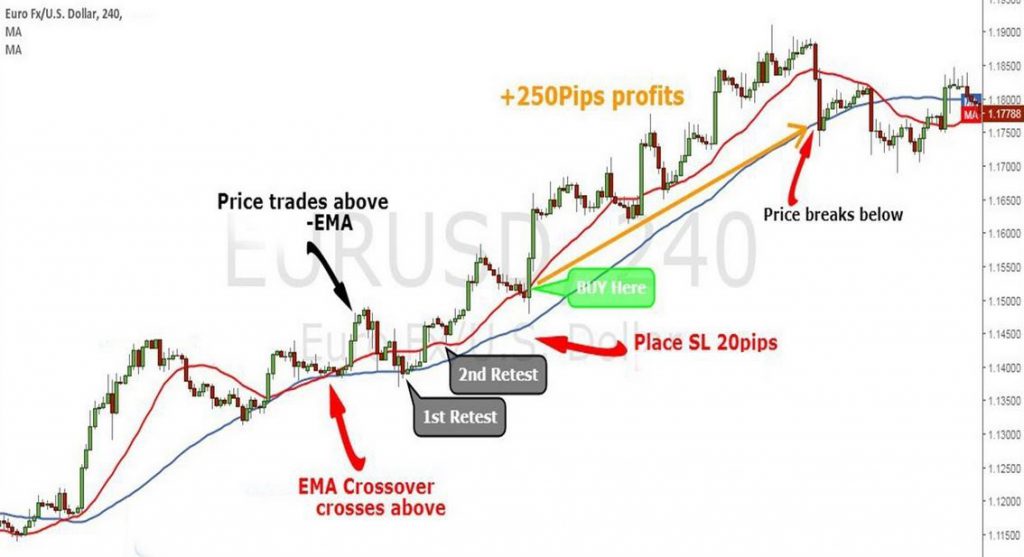
Long strategy
For going long, the price must cross above the moving average. A shorter moving average must cross above the longer one.
Short strategy
When going short, the price must fall below the moving average. The shorter one must cross below the longer one.
Bottom line
One of the most effective methods for determining the general market trend is to use crossovers. To enhance their trading strategies, traders can mix other technical analysis forms with moving average crossovers.

