The use of chart pattern recognition as the ‘method’ part of a trader’s overall edge contained in a trading plan can be a heated and subjective discussion amongst many in the trading community. Pattern recognition can be viewed as far too random and imprecise in order to make considered and calculated entry and exit decisions. However, as with many preferred methods, personal choice ranks highly. Chart pattern recognition also overlaps into price action detection, for example, particularly when identifying double tops and double bottoms, therefore even traders devoted to price action, (as their only predictive method), for price ‘prediction’ will inadvertently be using pattern recognition.
There are also many pattern recognition tools on the market that sit alongside the most popular charting packages that will signal opportunities, by way of audible alerts, as they arise. These packages have performed extremely well under peer review tests.
By way of introduction to pattern recognition concentrating on the most popular patterns reveals the relative strengths and weaknesses of the process vis a vis other methods of probability prediction. There are two principal recognised chart patterns most users attempt to identify; the reversal or continuation of the trend. This article will briefly highlight the use of the six most commonly utilised and recognised patterns. Most pattern recognition proponents use the methods for identifying trends, therefore swing and or position traders find the technique far more appropriate than scalpers or day traders.
Forex Chart Patterns
Head and Shoulders
The Head and Shoulders chart pattern is the most popular trend reversal formation proponents of pattern recognition and fledgling traders look for. It is most prevalent and reliable in uptrends. As the market starts to slow, with bulls and bears struggling for dominance, the price forms a peak (shoulder), followed by a higher peak (head), and then another lower peak (shoulder). When connecting the lowest two troughs, a ‘neckline’ is formed. The line doesn’t have to be a horizontal line to be classed as a neckline. Fledgling forex traders can often struggle when identifying this pattern due to the formation of inclined necklines. The pattern is complete when price breaks the neckline. Placing pending orders in the market just below the neckline is considered good technique. If price goes through the neckline on little volume a wave up could be occurring. After a wave up the increasing force of mounting selling pressure can be observed, price then often plummets with greater volume.

Double Top
This is a favoured forex reversal chart pattern favoured by many forex traders, particularly given that it’s synonymous with price action. The DT is most likely to become formed after an extended period of uptrend. A resistance level has not been broken, the price comes down, and then the bulls attempt breaching it for a second time. If the attempt is unsuccessful, the price will fall down from that level again. This is referred to as a Double Top. The pattern is complete when the forex market breaks the neckline. Placing short pending market orders just below the neckline is considered a good technique. It is highly probable that having failed to break resistance price will fall.


Double Bottom
This forex chart formation is quite simply a reverse of the Double Top pattern previously discussed. This pattern takes place after an extended downtrend when two bottoms have been formed. After the second bottom forms, the whole pattern looks like a sign that the bearish pressure is pretty much finished, and that a reversal is about to take place. If this pattern occurs it can be considered a good technique to place a long pending order to enter the market just above the neckline.

Symmetrical Triangles
Symmetrical triangles are chart patterns where the slope of the price highs and the slope of the price lows come together into a point. The pattern takes on the appearance of a triangle. Price makes lower highs and higher lows, and appears to be driven into a corner at which point the probability is that price will burst out, in either an upwards or downwards direction. Predicting the direction of the breakout is difficult.

Ascending Triangles
Ascending triangles are similar to symmetrical, however, the glaring difference is that there are no lower highs, only a constant line of resistance that is regularly attacked by the bulls bug not broken. As in symmetrical triangle formations the bottom part of the ascending triangle has an upward inclination. The fact that the triangle is ascending doesn’t necessarily suggest that the breakout will be on the upside. It could be either way. It’s considered good trading form to place your entry orders above the higher lows and above the resistance line.
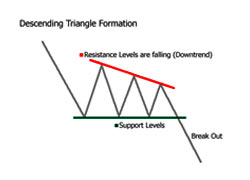
Descending Triangles
Descending triangles are similar to the symmetrical triangles with the obvious difference being that there is no higher lows, only a constant line of support that is regularly attacked by the bears without being broken. The fact that the triangle is descending doesn’t necessarily mean that the breakout will be on the downside. It could be either way. It’s considered a good trading technique to place entry orders above the lower highs and below the support line.

The charts accompanying this article also help to demonstrate the cleanliness of using recognisable charts for price prediction. For fledgling traders the suggestion would be to attempt to accurately pinpoint as many of these patterns as possible by manually drawing the patterns using the tools available with the most readily available charting packages. Or by subscription to one of the many reputable pattern recognition software applications currently available.


Comments are closed.