To be successful in trading, you must know how to interpret patterns. This is a very interesting subject, and GM Hartley is a familiar name in this regard. He wrote a book named “Profits in the Stock Market” in 1935 on these patterns. Even today, they are of much use in the forex market.
There are multiple patterns, e.g., crab, bat, etc., but the butterfly pattern is most prominent. I’ll show you how to use this pattern and assist you in trade. So keep an eye out!
What are butterfly patterns?
In simple words, the butterfly pattern is a four-legged reversal pattern. It aids in determining when a price movement has reached its end. It implies that you can penetrate the market during a price reversal.
There are usually two types of butterfly patterns. One is bearish in which you sell, and the other is bullish, in which you buy. But there’s one thing that’s crucial to consider: general precision. It enables a trader to reduce errors.
The configuration of the butterfly pattern
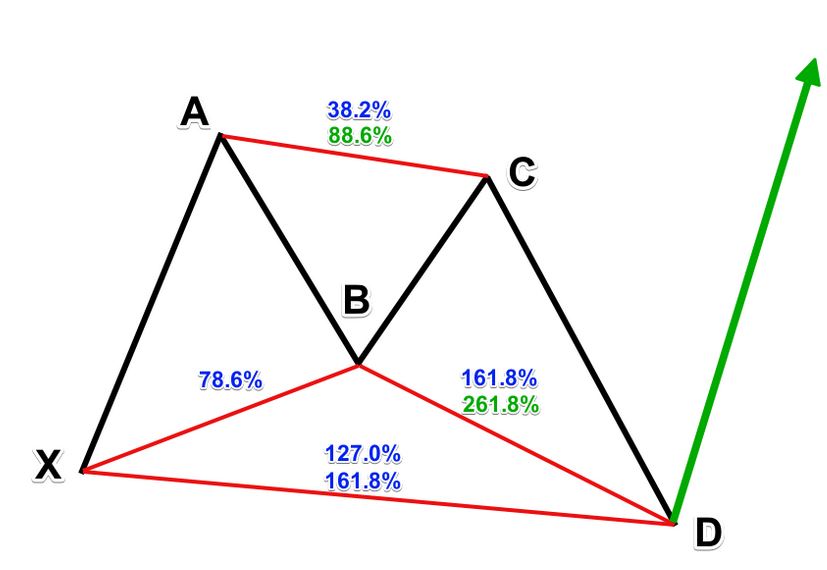
There are four price swings in the Butterfly pattern. Its appearance on the graph imitates the letters ‘M’ and ‘W.’ M in case of a downturn and W in an upward trend.
Let’s take an example. An “X denotes the pattern’s initiation.”

So, we can identify the four price swings of the structure as XA, AB, BC, and CD. Particular Fibonacci levels must be met to correctly identify these patterns. Let’s look closely at the Butterfly figure’s various Fibonacci relationships:
XA: This is the first move in the pattern. This move is exempt from any special rules.
AB: The Butterfly pattern’s B point is the most important level. It must trace back 78.6 percent of the XA leg.
BC: The BC move must take the AB move’s 38.2 percent or 88.6 percent retracement.
CD: CD will reach BC’s 161.8 percent extension if BC is 38.2 percent AB. Conversely, CD may reach the 261.8% extension of BC if BC is 88.6 percent of AB.
AD: The general AD move, which contains AB, BC, and CD, will be 127.0 percent or 161.8 percent of XA.

Reliability of butterfly patterns
According to statistics, a butterfly pattern increases the likelihood of a successful trade. After the butterfly’s completion, the reversals are typically sharper and tend to give strong indications.
It has a particular set of ratios to improve the pattern’s recognition. If these ratios and frameworks are visible, there is a chance that the pattern is as well.
Never undervalue the power of chart patterns in trading. They are crucial to determining entries and exits for a position. They may also signal a reversal or succession of the recent trend.
Butterfly patterns, in particular, can be useful for predicting the end of price swings. Moreover, when used correctly, these can accurately forecast future price movements.
Bottom line
We hope you now have an idea about the importance of these patterns. Whether you’re an amateur or expert in this field, you are certainly going to need these patterns.


