The art of the Fibonacci Forex trading strategy refers to ‘Mastering the time and price advantage’. To begin with, it is always a good idea to know some background information regarding where this increasingly popular trading method originates. First introduced to the West by Leonardo Pisano Bogollo in the 13th century, the Fibonacci sequence begins with an Italian mathematician.
Despite their mathematical properties and ratios, these strings of numbers can be seen in nature, architecture, and biology even today. These ratios’ wide applications also make them useful in financial markets. Fibonacci Forex trading strategies often help to identify market turning points, which is why you should also consider them. We will discuss using Fibonacci retracement levels effectively in your Forex trading strategy in our online trading education guide segment.

What are Fibonacci Retracements?
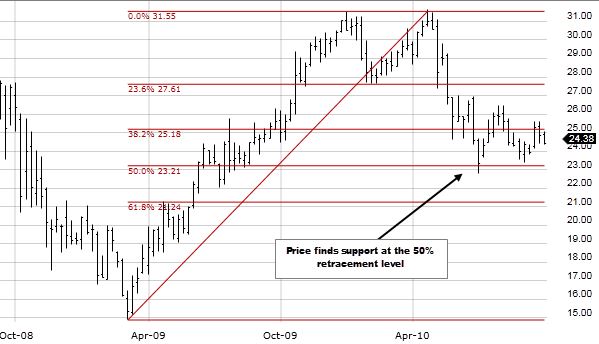
The Fibonacci retracement technique allows you to identify key support and resistance levels. Markets usually calculate by fusing Fibonacci levels after making large moves either up or down.
For identifying retracement areas before continuing the overall trend formed by a large price move, traders draw horizontal lines across a chart at the Fibonacci retracement levels of 38.2 per cent, 50 per cent, and 61.8 per cent.
How do traders use Fibonacci Levels in Forex?
Investors must consider how each of the strategies below might fit into their overall approach to the market since each trader’s strategy will differ. The following options may not be useful to every trader, and it’s fine if none of them suits your plan. A Fibonacci retracement can function in the following ways:
- Place a stop-loss order just below the 50 per cent level if you buy near the 38.2 per cent retracement level.
- Put a stop-loss order just below the 61.8 per cent level if you want to buy near the 50 per cent level.
- Fibonacci retracement levels can act as profit-taking targets after entering a sell position near the top of a large move.
You can identify possible future support and resistance levels if the market moves beyond the high/low reached before the retracement. Retracing near one of the Fibonacci levels, it resumes its last move. The higher Fibonacci levels of 161.8 per cent and 261.8 per cent can identify potential future support and resistance levels.
Finding support and resistance levels with Fibonacci retracement levels
In addition to counting the petals of flowers and calculating the growth of living cells with Fibonacci retracement levels, many forex traders use them to predict the direction of price movements.
Traders use the Fibonacci tool to identify resistance and support levels in the forex market. The above and below represent areas where a price reversal is likely to occur, and when they trade around Fibonacci retracement levels, they are extremely important. A trading chart’s target prices appear when Fibonacci levels are combined with support and resistance levels, giving you a better chance of finding profitable trades.
Trading style
To maximize profit potential and maintain control of their emotions, traders usually follow a trading style or set of strategies. Fibonacci trading strategies rely on hard data, so traders should be able to minimize emotional interference if they follow their strategy.
You can use Fibonacci trading strategies to make long- and short-term gains, whether you are trading for a few minutes or decades. However, most currency changes occur over shorter periods, so most trades are made quickly.

Bottom line
A Fibonacci strategy utilizes the “golden ratio” for all trading periods to determine entry and exit points. Due to its reliance on ratios that can’t necessarily apply to individual trades, this type of trading is highly contested. Limiting or removing emotional bias from trading is possible by sticking to a numerical trading strategy like the Fibonacci strategy.


