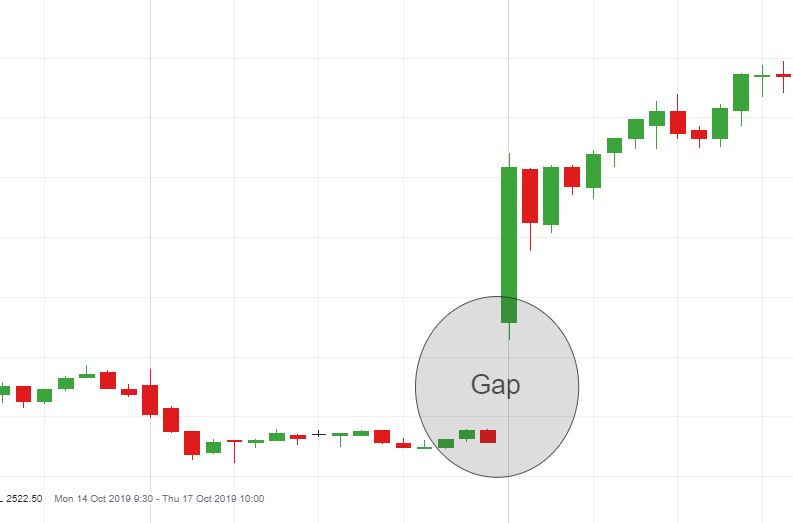
When big jumps in asset prices occur in volatile markets, traders can take advantage of them if they can turn them into opportunities. On a chart, gaps occur when prices of stocks (or other financial instruments) move sharply up and down with little trading in between.
A gap in the asset’s chart results from this deviation from the normal price pattern. Enterprising traders can exploit these gaps and make money from them. By reading this article, you will understand how and why gaps occur and how to use them to your advantage.

Gap basics
Underlying fundamental factors or technical factors cause gaps. For example, a company’s stock may gap up the next day if its earnings are much higher than expected. There was a gap in the stock price the day before because it opened higher than it closed.
Often, a forex report generates so much buzz that it widens the bid and ask spreads, creating a significant gap in the bid and ask spread. It is also possible for a stock that breaks a new high during the current session to open higher in the next session for technical reasons, causing it to gap up.
Gaps can fall into four groups:
- Breakaway gaps: Usually, it occurs at the end of a price pattern and signals the start of a new trend.
- Exhaustion gaps: Price patterns tend to end with this pattern, so it signals a final attempt to make a new high or low.
- Common gaps: The gaps are not part of a price pattern; they merely indicate a price change in the past.
- Continuation gaps: Known as runaway gaps, these occur in the middle of a price pattern and are often the result of investors who share a common view of how the asset will perform in the future.
Gap trading example
To better understand these concepts, let’s examine a simple gap trading system developed for the forex market. Using gaps, this system predicts retracements to a previous price. Observe these rules:
- Charts showing hourly price movements are a good guide to the direction of the trade (be sure to check them).
- Creating a price gap between the currency’s 30-minute chart resistance level and the key support level is necessary.
- The price must retrace back to the original resistance level. As a result, there has been a gap filling, and the price has returned to the support this was before.
- It is necessary to have a candle indicating the price is continuing in the direction of the gap. Maintaining the support will be easier this way.
A gap in the forex market appears as a large candle on a chart because it operates 24 hours a day (it opens at 5:00 pm EST on Sunday and closes at 4:00 pm EST on Friday). A large candle usually occurs by a report release, which causes sharp price movements with little liquidity. When the market opens after the weekend, the only visible gaps on a chart are after the weekend.
To fill or not to fill
In the case of gaps, when someone says the price has filled a gap, they are referring to the price has moved back to where it was before the gap closed. It is quite common for these fills to occur due to the following reasons:
- Irrational exuberance: It is possible that the initial spike was overly pessimistic or optimistic. Therefore, a correction was necessary.
- Technical resistance: Support and resistance aren’t left behind when a price moves sharply up or down.
- Price Pattern: An analysis of price patterns can tell you if a gap will be filled or not by classifying gaps. The likelihood of exhaustion gaps filling is higher since they indicate the end of a price trend. In contrast, continuation and breakaway gaps are significantly less likely to be filled since they confirm the current trend direction.
The term fading refers to the process of filling gaps on the same trading day that they occur. Imagine a scenario where, after a company announces a great quarterly profit, it gaps up at the opening (in other words, it opens much higher than its previous close).
In this scenario, as the day progresses, people discover that the cash flow statement shows some weaknesses, so they begin to sell. The gap eventually closes when the price reaches yesterday’s close. This strategy is very popular during earnings season or during other times of irrational exuberance.

Bottom line
A gap on a chart occurs when the price of the financial instrument changes significantly over a short period without much trading. The perceived value of the investment can change unexpectedly due to underlying fundamentals or technical factors. Based on their timing and what they signal, gaps can serve as breakaway, exhaustion, common, or continuation.

