
Trend trading is one of the easiest and recommended form of trading for beginners in the forex market.
But there is a certain situation when the trend starts to change its course. This is when most traders feel panicked.
To avoid this scenario, you need to determine the trend reversal. A reversal is a time when the direction of the pair changes.
Often, trend reversals occur in intraday trading, but they can also come in different timeframes.
But how to spot a trend reversal?
We are here to help as in this guide, we’ll walk you through what tools are required to identify the trend reversal.
Trend reversal tools:
1. Indicators
They mark overbought and oversold zones. As soon as sellers or buyers’ strength reaches a critical point (a critical point is an area where the trend reversal was encountered earlier), it begins to dry out.
This is a sign of reversal.
There are many examples of such indicators. These are stochastics with RSI and trend strength indicators.

2. Patterns
The Price Action strategies do not imply the use of indicators. Their supporters believe that the formed candlestick is a psychological reflection of the state of the market, which means pending orders can be set based on reversal patterns. So, they use candlestick patterns to determine a trend reversal.
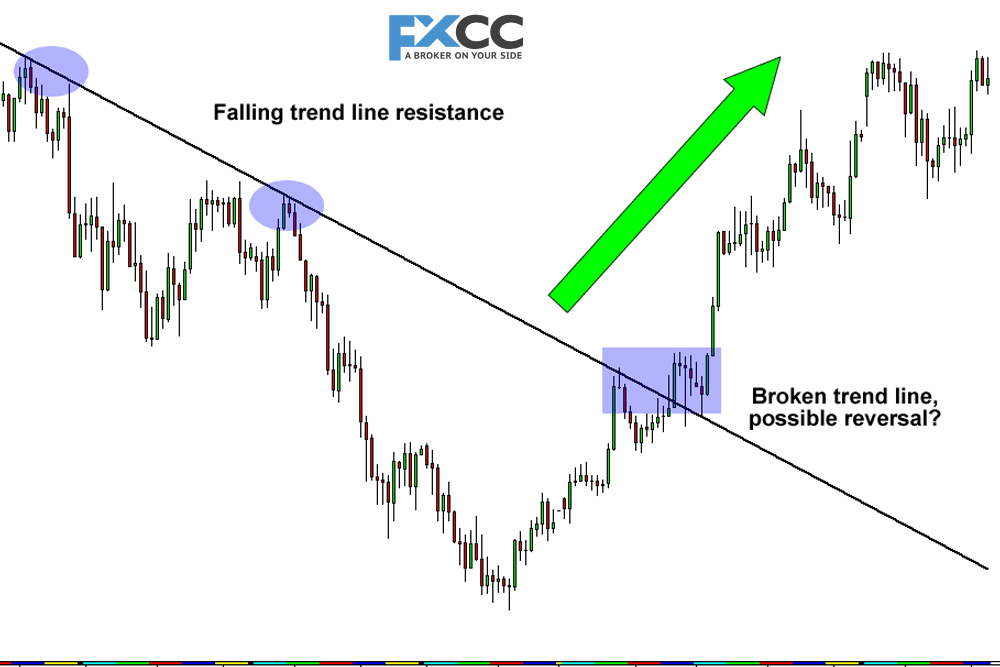
3. Levels
There are many strategies in the forex market. Some traders like to use support and resistance levels or Fibonacci levels on several points.
There are many approaches to building levels: levels on different timeframes, round levels, etc.
There are many variations, but the fact is that this skillful tool can help determine the trend reversal point.
4. Divergence
It is believed that the discrepancy between the price and the indicator is a sign of a reversal. Sometimes yes, sometimes no. Therefore, you should be careful with this tool.
5. Pivot points
Pivot points are those points at which a change in trend direction occurs. Pivot point calculators are also used to calculate resistance and support levels where a rebound is possible.
There is a misconception that a slowdown in price movement precedes a trend reversal. However, certain factors like the decline in business activity due to holidays or weekends, news releases, and market oversaturation can affect the price’s direction.
Example of a trend reversal
Suppose the price of EUR/USD moves from 1.235 to 1.236. A trader sees potential in the pair and continues to ride the trend. Then, the pair starts to drop, and it reaches 1.232. A trader was well aware of the downtrend as there was a trend reversal at 1.234 and also at 1.233.
In this way, a trader can watch a reversal and can get out of losing position.

Conclusion
There are no universal methods for determining trend reversal. Each market situation and asset has its own tools to increase the accuracy of the market forecast.
Besides this, different traders have different strategies. Some like to trade Japanese candlesticks, and some find Fibonacci levels interesting. Although you can combine several tools to find a trend reversal, but remember that cluttering the chart is misleading.
New to Forex trading? Don’t miss these beginner guides from FXCC.
– Learn Forex Trading step by step
– How to read Forex charts
– What is spread in Forex Trading?
– What is a Pip in Forex?
– Low Spread Forex Broker
– What is Forex Leverage
– Forex Deposit Methods

