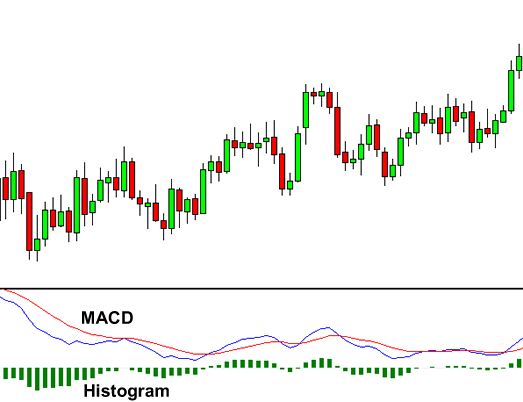
One of the most popular technical indicators for day trading and forex is the MACD. It measures the difference between two exponential moving averages and plots the difference as a line graph. A histogram depicting the difference between the second signal line and the MACD is then plotted. It is possible to change the settings of MACD to a different time, but most traders tend to prefer the default settings
How to read the MACD indicator
We can read the MACD indicator in two ways:
1. Whether the market is oversold or overbought
2. Whether the market is up-trending or down-trending
An example of MACD trading strategy
For any day trading system, all the rules must be clearly defined as easy to follow. This system is called MACD crossover. Their rules are as follows:
Long/short: One should take long MACD signals when the price is above 200 period-moving average.
Entry: Buying will be better when MACD crosses over the zero lines.
Sell: One must sell at a profit or loss when the MACD crosses below the zero lines.
How MACD trading strategy works
The MACD system seeks to buy when it detects that the price moves from a down trending environment to an up trending environment. As the MACD signals start moving back into a downtrend, the next objective is to ride that uptrend for as long as possible before you sell. To avoid trading against the direction of the major trend, it is also necessary that the price is above the 200-period moving average.
Simplest MACD strategy
The simplest MACD trading strategy is called a single-line crossover strategy or a MACD crossover strategy. When there are strong trends in volatile markets, this process works better. This single line represents the 9-period EMA of the MACD line. Due to its MACD line average, it follows after the formation of the MACD line. The MACD line turns upwards and crosses beyond the signal line when there is a positive crossover.
In contrast, a bearish crossover will occur when it exceeds the single line and crosses downward. This condition calls for making sure that both lines are as far apart from each other as possible when it occurs. In addition, it indicates that the momentum of the price will continue in the desired direction.
Drawbacks of using MACD
There are also some disadvantages to MACD, including:
In general, the price is normally well above the bottom when MACD crosses above zero. Likewise, when the MACD crosses below the zero lines, the top has already occurred.
Bottom line
The MACD indicator is one of the most common tools used by investors and traders to spot trends. Investors can identify price turning points by recognizing shifts in momentum. However, along with several benefits of the tool, there are some disadvantages of the MACD indicator as well. The core drawback of the tool is that it is a lagging indicator that moves after the price. So, you may not be able to see an early sign of reversal as in the case of price action or candlestick based trading.

