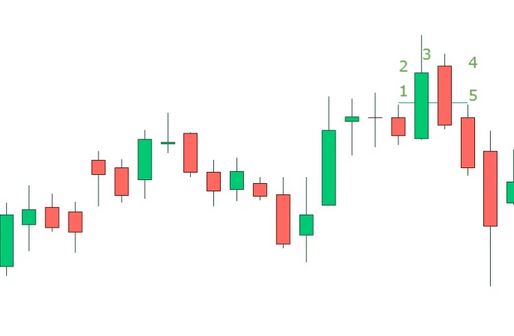
After you understand the basics of candlestick charts, you can learn about Bearish Candlestick Patterns. These patterns show that the current uptrend is likely to turn around into a downtrend soon.
A bearish reversal candlestick pattern doesn’t have to have a certain number of candlesticks.
At the top of a candlestick uptrend, it is normal for bearish reversal patterns to show up. Bearish reversal patterns can give you reversal signals, but you should recheck them with volume and resistance levels to be sure.

The Hanging Man
The Hanging Man is basically a bearish reversal candlestick pattern. It has a long bottom trading shadow and a short actual body.
At the end of an uptrend, this bearish candlestick pattern shows that the bulls have pushed the price as high as they can and that the underlying trend is weakening.
The true body isn’t considerable, meaning there wasn’t much difference between the opening and closing prices. It shouldn’t have a shadow above it, and the shadow below it should be twice as long as the body.
This pattern makes it easier for traders to switch from being extended to short.
Dark Cloud Cover
Dark Cloud Cover is a bearish reversal trading pattern that shows up at the end of an uptrend when the uptrend is starting to slow down.
In this trading pattern, the first candlestick is bullish, and the second is bearish. As prices go up, this pattern becomes more important as a sign of a change.
When the bearish engulfing pattern forms at the peak of an uptrend, it is a bearish reversal pattern that indicates a change in the uptrend and a price drop as sellers compete for market share.
When sellers enter the market and push prices down, they stop this pattern from continuing.
The pattern is made up of precisely two candles. The second bearish candle eats up the “body” of the first green candle.
The Evening Star
The Evening Star is a candlestick pattern that investors use to tell when a market going up is about to start going down.
The three candlesticks may help you figure out this pattern. It has a big bullish candlestick, a small candle with a small body, and a bearish candlestick.
The Three Black Crows pattern
The Three Black Crows pattern uses several candlestick formations to predict that a trend will change from going up to down.
Three trading days in a row, sellers used bearish forces to drive prices down. Once a bearish candlestick pattern has formed, you can trade short on the market.
Traders should use volume and technical indicators to double-check that this candlestick pattern is taking shape.

Conclusion
That’s the end of our tour of the most common ways to arrange candlesticks. You might be wondering where in the wild to look for them.
We have a few quick reference guides, but they are a few. They help when you don’t know what to do. To fully understand these patterns, you need to know something about them. You might lose credibility if you tried to trade without the correct paperwork. You need to practice and be patient.


