The volume profile is a tool for traders, where you can find a basic level that the leading players in the market consider when trading. You can also name it horizontal volume.
The value of this trading tool lies in the fact that it can mix and match with any marketing strategy. Furthermore, after analyzing the horizontal volume market, you get a more reliable signal that can be used to confirm or reject the received entry point.

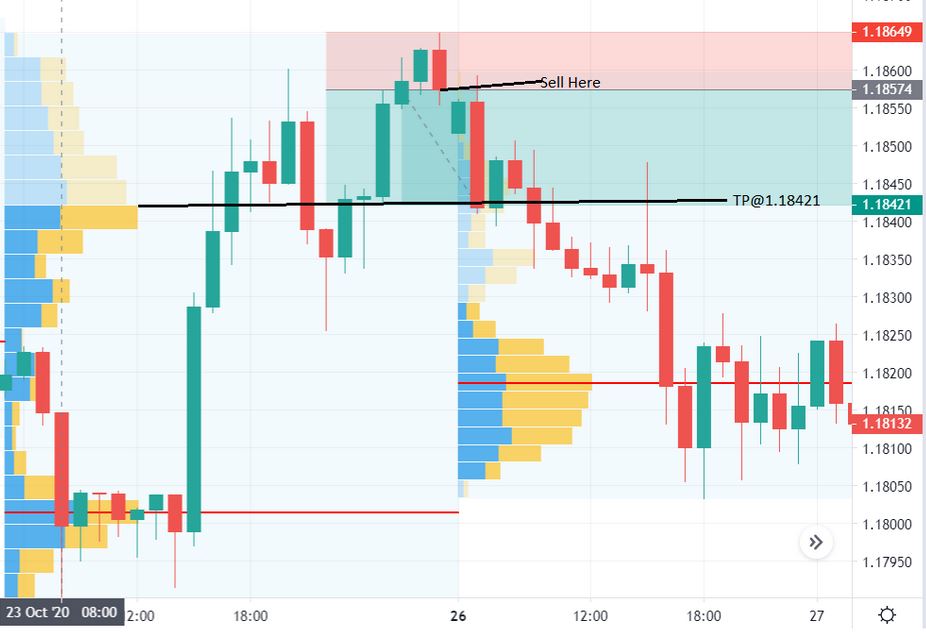
How volume profiles work – step-by-step instructions
We will here translate all of the above into a step-by-step process:
- You can see the “value zone” using horizontal volumes.
- Change your business strategy and determine the direction in which you will sell.
- Set Stop Loss and Take Profit.
- Wait for the “Distribution” section.
You can improve your earnings chances by following the scheme described and using the correct Stop Loss and Take Profit ratio. In addition, the volume profile is a handy trading tool where you can find meaningful entry zones.
However, whatever you are trying to do, horizontal volumes will not help you determine the direction in which the market will be divided.
What is a volume profile indicator?
The volume profile is an advanced graph study and indicator. It shows the value of the amount of asset sold at a specific time and a particular price level. The volume profile uses previously sold volume, and all strategies and plans are taken from historical data.
How does the volume profile indicator work?
You may see strange colored bars on the right side of the map next to the price level when you first see the volume profile.
But don’t worry!
After reading this detailed article, you will know what these volume indicators are and how you can use them.
It takes the total volume sold at a certain price point over a specific period, divides the total volumes bought and sold, and displays them in a histogram graph. As a result, traders can fully understand and use this volume profile indication as the most powerful tool within the trading arsenal.
What are the basic rules for volume profile?
You can identify market conditions by volume profile. If you know what market state you are in, these rules will tell you what to look for in the volume profile of different market states.
If the price consolidates (expands the price):
- The range of values will be in the middle of the volume profile.
- The price will be between HVN and LVN
If the price rises (rising trend):
- The value range is located at the bottom of the volume profile. • The price is likely to return to Value Area High
If the price falls (declining trend):
- The range of values is above the volume profile.
- Price is likely to keep pace with lower prices.

Final thoughts
Horizontal volumes and volume profiles are unique tools that can help identify critical horizontal levels. With their excellent help, you can look for the entry point or set Stop Loss or Take Profit. Horizontal profile volumes are a tool that can be a major part of almost any trading method. You do not want to work with horizontal signals without acknowledgment signals. In this case, you will receive many error signals. Horizontal volumes can be helpful on any trading exchange such as Forex, stock market, futures, commodities, and spot.

