Traders use indicators such as parabolic SAR and parabolic stop and reverse primarily to estimate a given asset’s short-term momentum in the future.
A trader can easily use this indicator, developed by the famous technician J Welles Wilder, Jr, to determine where to place stop orders within a trading strategy. (An indicator like this is rather complex to calculate and is not directly applicable to trading.)

Understanding the Parabolic SAR
Traders can use this indicator to determine whether they hold a full position in a particular position at any given time. Because of this, it is especially interesting to traders and those who create trading systems.
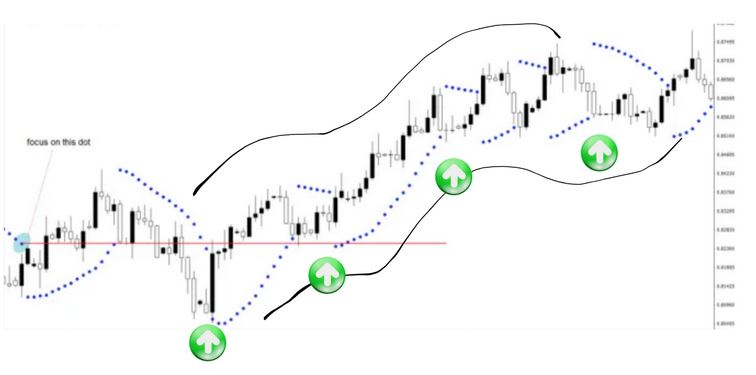
An asset’s parabolic SAR indicators appear as dots above or below its price (based on momentum). The price of an asset is placed below a small dot when it’s trending upward; a dot is placed above it when it’s trending downward.
Trailing stop-loss orders are often placed at SAR values as traders anticipate an opposite trend if prices move beyond this level. As long as the parabolic SAR resides far enough from the price during a sustained trend, it will not stop the trader from taking a position during temporary retracements, allowing the trader to ride the trend for a long time and generate substantial profits.
The Parabolic SAR calculation
According to the indicator, stop and reverse levels appear on the chart. The formula for parabolic SAR is as follows:
SARNEW = SARCURRENT + AF x (EPCURRENT – SARCURRENT)
Below is a definition of the formula terms:
- AF = Acceleration Factor – a value that increases when a new high appears for a short position or a new low for a long position. The initial value of AF would be 0.02, increasing in 0.02 increments to a maximum of 0.20.
- EP = Extreme Point – the highest or lowest price seen during the current trend (uptrends highest, downtrends lowest).
Parabolic SAR indicators aim to guide the direction of trending markets. According to Wilder, trending markets have a high probability of remaining within the constraints of the chart’s curve.
The trend may have run out of steam if the price does not achieve this and breaks through the curve instead. At such times, you should retrace your steps and stop.
A good grasp of how the Parabolic SAR indicator works, what the different parameters mean, and how it can be modified can be very useful to your understanding of how it works.
However, don’t worry about having to conduct the calculations yourself, even though it’s useful to know! MT4 and MT5 offer a Parabolic SAR calculation built into their trading platforms!
Markets and the Parabolic SAR
Markets with a steady trend perform best with parabolic SARs. Parabolic SARs tend to whipsaw in range-bound markets, generating false trading signals. According to Wilder, the parabolic SAR should use the average directional index (ADX) momentum indicator to accurately identify the prevailing trend’s strength.
Candlestick patterns and moving averages are also factors that traders may take into account. For example, prices falling below major moving averages can be considered separate confirmations of a parabolic SAR sell signal.

Bottom line
Technical indicators, such as Parabolic SAR, can help determine where stop orders should be placed based on short-term momentum. A moving price beyond the SAR value signals a reversal, hence trailing stop-loss orders. An asset’s momentum indicator appears graphically on its chart as a series of dots placed above or below its price. A steady market trend tends to be favored by the indicator, which assumes the trader is fully committed to a position at all times. Parabolic SARs are rather complex to calculate.

