Traders use trading patterns and signals to profit from rising and falling markets with smaller but more frequent profits. The accuracy of some technical indicators is debatable, but most patterns have proven their reliability to traders in identifying key entry and exit points in the market.
In essence, what is a harmonic butterfly pattern? This article discusses how to identify the pattern, trade it, and what it looks like.

What is a harmonic butterfly pattern?
Technical analysts use harmonic butterfly chart patterns to identify turning points in the market by identifying five-point reversals. It is a trading pattern with specific shapes and distances between each trend.
Any liquid market, such as crypto, and any time frame chart can use the harmonic butterfly. Butterfly patterns belong to the harmonic family along with Gartley patterns, bat patterns, crab patterns, and AB-CD patterns.
Harmonic butterfly pattern
H.M Gartley established harmonic price patterns in 1935. Gartley wrote about a 5-point pattern that became known as the Gartley pattern. It was eventually possible to improve harmonic patterns by incorporating relative distances between points. As a result, traders could analyze the real-time probability of the pattern developing using Fibonacci ratios.
There have been many improvements made to Gartley’s work over the years. Scott Carney’s Harmonic Trading series is perhaps the most comprehensive of all.
Is the harmonic butterfly pattern reliable?
There are similarities and differences between the harmonic butterfly pattern and other chart-reading patterns. An important question is whether a pattern is reliable. The analyst’s ability to read a pattern correctly determines the pattern’s reliability.
Pros
By clearly identifying the formation on a chart, traders can gain confidence due to the geometric nature of the pattern, which Scott Carney has thoroughly researched. Further, ratios identify the pattern. It is more likely that the pattern will also be present if these ratios and structures are present.
Cons
A trading pattern can’t be 100% accurate. It’s common for patterns to display all the correct ratios and look right – but fail to perform. Stop loss orders are crucial to every trade because of this reason. Following the guide above will help you determine where to set your stop loss without over- or under-risking.
Essential tips about butterfly chart pattern
Remember the following tips when implementing the butterfly pattern on the price chart.
- Butterfly patterns occur at trend ends and are reversals.
- Sharper reversals characterize butterfly patterns.
- Butterfly patterns tend to operate on large timeframes due to their complexity.
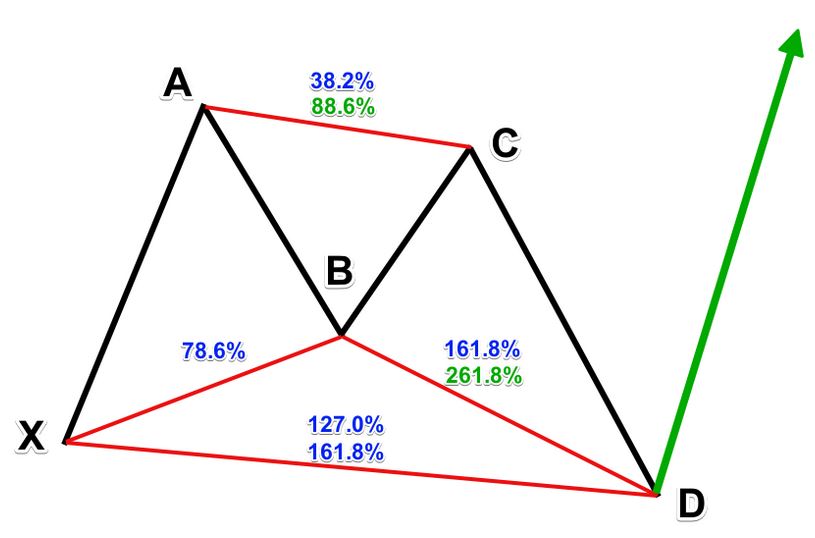
- The Fibonacci indicator should be applied when drawing the butterfly pattern. There are specific levels in the Fibo tool. To visualize the pattern better, you should add levels 78.6%, 88.6%, and 127%.
- A butterfly pattern will emerge in the case of a price reverse after Point D.
- Depending on the B point, the butterfly pattern takes on its entire shape. The structure of the butterfly depends on it. Additionally, it serves as a starting point for other measurements. The structure of the pattern determines trade opportunities within it.

Bottom line
Traders who are seasoned follow the harmonic butterfly pattern. This pattern creates a specific look and ratio between each trend for traders familiar with Fibonacci retracement levels. There are, however, some limitations to the pattern. Every trade should have a stop loss in case the market abruptly reverses.

