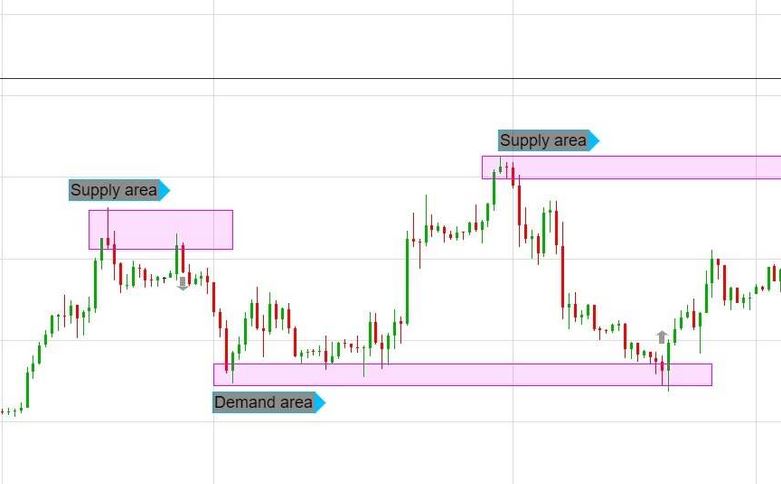
A price action trader makes trading decisions based on price movements rather than technical indicators. Traders have access to a wide range of tools. This article offers a detailed description of this type of trade and some great beginner trading tools.

What is price action trading?
Some traders make decisions based on the price movements of an asset. Price action trading involves following the movement of prices and trading based on their belief that these actions will be profitable.
Technical indicators, such as Bollinger bands and moving averages, are rarely used by price action traders, but if you do, give them very little weight when making your trading decisions. Price action traders believe that the price and its movements provide only reliable information.
The price of an asset increases when it has more demand among buyers. A price action analysis follows, in which analysts evaluate the aggressiveness of buying, historical charts, and real-time data (bidding, offers, volume, velocity, magnitude) to determine the price action.
How do you read price action?
It’s important to have good charting software available if you want to read price action. In most brokerages, you can find some charting features on their website or app. A third-party charting service like TradingView or Yahoo! Finance may be better if you’re unsatisfied with the brokerage’s options.
Price action trading tools
In price action trading, breakouts, candlesticks, and trends are all preferred tools. In addition, they use theories such as support and resistance. The tools and ideas traders use to develop their trading strategies are influenced by their preferences.
Breakout
Traders are alerted to new trading opportunities once an asset’s price breaks its trend when it moves with a specific tendency.
For instance, an asset has traded between $11 and $10 for the last 20 days and then moves above $11. In this case, traders are alerted that the sideways movement could end and that a move to $12 (or higher) might be on the horizon.
A breakout can form from many different patterns, such as ranges, triangles, head-and-shoulders, and flag patterns. There is no guarantee that a breakout will keep the price moving in the anticipated direction, and it often does not do so. Those instances are called “false breakouts,” and they present trading opportunities in the opposite direction of the breakout.
Note
The size of a breakout can vary. Breakouts during a trend can be excellent opportunities to profit if you’re looking for small consolidations or short periods where prices move sideways.
Candlesticks
A candlestick chart shows an asset’s trend, open, close, high, and low price at a given time. Candlesticks are used in a variety of trading strategies. For example, Candlestick charts can be used to analyze trends with the help of the engulfing candle trend strategy.
Trends
Prices can continue to rise or fall throughout the day for an asset. In the case where the price rises, these are called “bullish” trends; on the other hand, in the case where the price drops, they are called “bearish” trends.
Support and resistance
Traders use price support and price resistance regions to identify good trading opportunities in conjunction with the above. In the past, support and resistance areas had occurred when the price reversed. In the future, such levels may become relevant again.

Bottom line
Price action trading can be beneficial to all new traders. It becomes a trading system on its own when one learns to read and interpret price chart movements. Integrating other analysis tools, such as statistics or indicators, can be useful. To start trading, you only need to learn one method. Before learning more, make sure your chosen strategy is profitable. Although price action trading cannot guarantee profits, it is an excellent trading style with practice.


