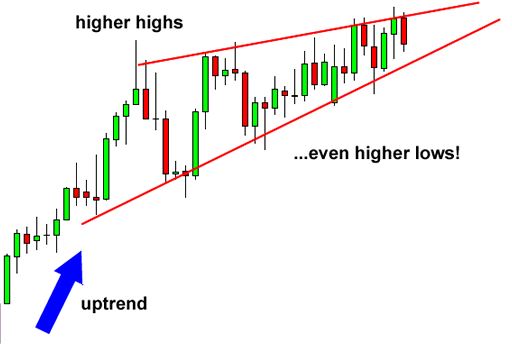
A wedge pattern can indicate either a bullish or a bearish price reversal. In any case, a pattern like this has three characteristics in common: first, converging trend lines; second, declining volume during the pattern; third, a breakout from a trend line. The wedge pattern comes in two forms: a rising wedge (which indicates a bearish reversal) or a falling wedge (which indicates a bullish reversal).

Rising wedge
Typically, this occurs when a security’s price has increased over time, but it can also happen when the price falls.
Analysts and traders can anticipate breakout reversals by drawing trend lines above and below the price chart pattern. It can happen that the price breaks out of one trend line or the other, but wedge patterns tend to break out in the opposite direction from the trend lines.
Consequently, rising wedge patterns indicate that prices are more likely to fall after a breakout of the lower trend line. A bearish trade can be made following a breakout by selling the security short or using derivative instruments such as futures or options. A trade like this seeks to profit from the possibility that prices will fall.
Falling wedge
Wedge patterns can form just as a security’s price makes its final downward move in a trend that has been falling for some time. As the price slide loses momentum and buyers step in to slow the decline, the trend lines drawn above the highs and below the lows will converge. The price may break above the upper trend line before the lines converge.
The security price is expected to reverse and trend higher when it breaks the upper trend line. When identifying bullish reversal signals, it would be wise for traders to look for trades that profit from the security’s price rise.
What is the significance of Rising and Falling wedges?
Wedges suggest that the market cannot decide whether to break up or down. The price may move substantially in the direction of the break after the price breaks the flag.
So how do I use them?
Prices can be interpreted with flags when there is a large break in price. A large move to the downside is possible if the price breaks through the flag. In the same way, if the price breaks through the flag to the upside, a large move-up may occur. It is usually the case; however, that price breaks to the left of the wedge. These can be used to confirm Gartley and butterfly patterns or to identify trends.
The advantages of wedge patterns in trading
Trading systems that employ price pattern strategies seldom outperform buy-and-hold strategies over time, but some patterns are useful in general forecasting prices. More than two-thirds of the time, wedge patterns will break out toward a reversal (bullish breakouts for falling wedges and bearish breakouts for rising wedges), with a falling wedge being more reliable than a rising wedge.
In wedge patterns, the distance between entry and stop loss prices is smaller than at the start since wedge patterns converge to a smaller price channel. By placing a stop loss close by when the trade begins, you can increase your return if the trade succeeds, and if the trade fails, you can reduce your loss.
The Falling wedge pattern: bullish or bearish?
In the case of a falling wedge pattern, it is considered a bullish signal since it signifies the beginning of a trend that is slowing down, and it signals the movement of buyers to stop it.
The Rising wedge patterns: bullish or bearish?
A rising wedge pattern is usually bearish, meaning that a stock that has been rising is about to experience a breakout reversal and is, therefore, likely to fall.

Bottom line
The wedge pattern is characterized by converging trend lines throughout 10 to 50 trading sessions. It depends on the direction of the patterns to determine whether they are rising or falling wedges. Historically, these patterns have been able to forecast price reversals with an unusually high level of accuracy.


