Engulfing is a well-known reversal pattern on a chart that consists of two candlestick patterns, but one pattern will engulf the other. In this case, it is important to correctly distinguish the type of pattern – it will depend on which candlestick pattern is dominant.
There are two types of engulfing in total – bearish and bullish. We will consider these two options further and in detail.
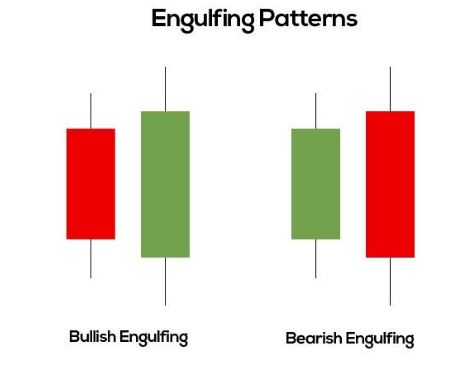
Bullish and bearish engulfing patterns and their structure
Since both bullish and bearish patterns are reversals, this would indicate a change in trend or a powerful pullback in price. Such patterns can only appear on the Japanese candlestick chart. For example, if a trader trades using the Heiken Ashi system or bars, then such models cannot be found – they cannot be seen there due to the peculiarities of the graphical markup.
Note that an Engulfing pattern will always indicate a trend change, but the first candlestick pattern should not be a Doji. With all this, its body should be smaller than the body of another candle. Based on such a chart, it turns out that one candlestick pattern engulfs another.
An important detail: the candlestick patterns must have a different color, and one of them must be bearish and the other bullish.
The fact of engulfing must necessarily be, but the shadows of the candlestick pattern may well remain outside since their participation in this process is not so necessary. If you see such a pattern on the chart, then you can get ready for a new trend to follow – a powerful and long-term one.
Such an arrangement of patterns is quite common on charts, but the significance increases significantly only when the price moves into the oversold or overbought zone. Such signals can be determined using points on the chart (for example, Bollinger waves) or using technical instruments: Stochastic, RSI.
You can use the CandleStick Patterns indicator to automatically search for patterns on the chart.
Bullish engulfing pattern
This pattern is a reversal pattern in the Japanese candlestick chart. It usually manifests itself at the moment when the trend becomes a downtrend. In this case, the body of the second candlestick figure becomes completely white and completely covers the figure of the first candlestick, which is black on the chart. This positioning on the chart indicates that one candlestick pattern is bearish and the other is bullish. In other words, bulls dominate bears, hence the name of the pattern.
Here the daily time frame was used, the trend was downtrend, the currency pair was USD and Japanese yen. On such a chart, one can foresee the growth of quotes and a change in the direction of the trend.
Bearish engulfing pattern
Here, the pattern will consist of two Japanese candlestick patterns, which appear on the chart at the time of an uptrend, which indicates an imminent trend change. With this arrangement, the first candlestick pattern should be bullish and the second bearish. The latter absorbs the former, hence the name.

