Indicators like this might intimidate newbie traders just by their name, but they won’t change their minds once they see them on the chart. Indicators such as Ichimoku Kinko Hyo seem complicated and difficult to use, which is why many traders avoid them.
Nevertheless, it’s an indicator that traders widely use. We’ll explain it in the most straightforward way possible.

Ichimoku Kinko Hyo: What does it mean?
A technical analysis indicator known as Ichimoku Kinko Hyo originated by the Japanese journalist Goichi Hosoda in the 1960s and consists of five lines: the tenkan-sen, kijun-sen, senkou span A, senkou span B and chikou span.
There are a variety of uses for this indicator, including gauging momentum, identifying trends, and placing support and resistance levels.
How to interpret and calculate the Ichimoku Kinko Hyo
Let’s take a closer look at the five lines of the indicator.
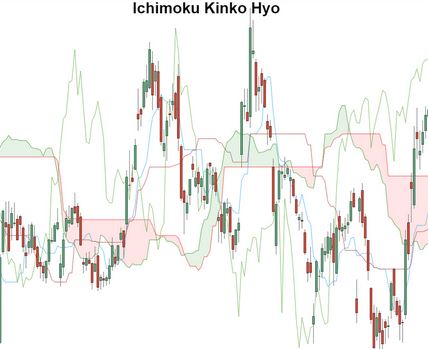
- To calculate the Tenkan-sen (the blue line), add the highest high and the highest low over the past nine periods and divide by two. This line helps to identify support, resistance levels, and trend reversals.
- As a trailing stop-loss point, the Kijun-sen (brown line) comes by adding the previous 26 highest and lowest lows.
- The Senkou Span A, or Leading Span A, is derived when the tenkan-sen and kijun-sen are added and divided by two. You plot the result 26 periods in advance. It reflects future support and resistance.
- If you add the highest and lowest highs from the past 52 periods, multiply the result by two, and plot it 26 periods in advance, you will find the Senkuu Span B (the red line). In addition to Senkou Span A, this line identifies future support and resistance areas in the cloud.
- As with the others, Chikou Span functions similarly, i.e., to find possible support and resistance levels based on the current period’s closing price 26 periods back.
Why does Ichimoku matter?
It only takes two minutes to catch this indicator’s signal, even though it has many lines that can create noise on the chart. Ichimoku offers so many signals that no matter what signal it is: trend reversals, momentum, or buy/sell signals.
It has plenty of lines to cover a wide variety of market conditions. Furthermore, the indicator appears pretty accurate, although it occasionally gives false signals.

Common Ichimoku mistakes
Most traders need to understand their meaning to avoid misinterpreting lines. Because it’s hard for them to remember their names and functions, traders need to get the right signals.
You only have to choose which colours to use and set a colour for each line.
There are two mistakes you can make when trading: Market noise. You should avoid applying too many indicators.
Ichimoku should work with other indicators for more reliable signals, but you should implement only a few at once. Only one additional indicator should be used, and it should be placed below the chart. Oscillators are always visible under the chart, so signals are always evident.
Bottom line
Ichimoku Kinko Hyo looks and sounds complicated. Many traders don’t use it because of that, but that’s a big mistake. You must learn which colours to use for each line and what signals they provide. You can start by simply saving the section of our article discussing each line’s function and using it as your trading tool. To put your knowledge into practice, open a demo account. This new indicator will allow you to build a trading strategy for free and easily.

