There is no exception to the importance of using support and resistance levels on all timeframes. Traders new to the market often do not understand how pivot points work, but Pivot Points provide a great solution to this issue.
Using pivot indicators, limit and stop orders can be automatically calculated on which to place in Forex. Graphs of support and resistance levels have very subjective meanings in technical analysis. Support and resistance levels do not always look the same. However, the pivot indicator generates marks based on a set formula that cannot be interpreted differently.

What is a pivot point?
Technical analysis pivot points are a means of determining overall market trends over different time frames using technical analysis indicators. As the name suggests, the pivot point is simply the average of the intraday high and low prices and the last day’s closing price.
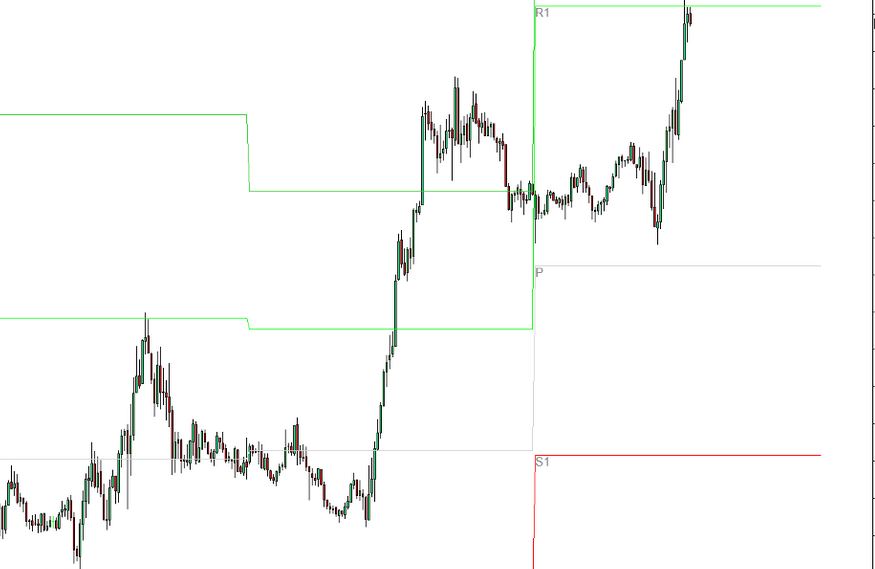
Trading below the pivot point indicates bearish sentiment, while trading above it indicates the bullish sentiment on the following day. Besides the pivot point, the indicator also consists of other support and resistance levels calculated using the pivot point.
Traders can use these levels to evaluate possible levels of support and resistance. A price that moves through these levels also gives traders a clue as to the direction the price is heading.
Calculation techniques
For most traders, the five-point system is the best method of calculating pivot points. Based on the previous day’s highs, lows, and closes, as well as support and resistance levels, the system calculates the current price. The five-point system is based on the formulas below:
- Pivot point (P) = (Previous High + Previous Low + Previous Close)/3
- S1= (P x 2) – Previous high
- S2 = P – (Previous High – Previous Low)
- R1 = (P x 2) – Previous Low
- R2 = P + (Previous High – Previous Low)
Where:
- S1= Support 1
- S2 = Support 2
- R1 = Resistance 1
- R2 = Resistance 2
What do pivot points tell you?
A pivot point is an intraday indicator for trading stocks, commodities, and futures. Their prices remain the same throughout the day, unlike moving averages or oscillators. Trading levels can help traders plan their trades.
Traders will sell early in the session if the price falls below the pivot point. If the price rises above the pivot point, they will buy. For such trades, you can also use S1, S2, R1, and R2 as target prices and stop-loss levels.
The combination of pivot points and other trend indicators is common among traders. Ideally, pivot points overlapping or convergent with moving averages (MA) or Fibonacci levels become more reliable to use as support/resistance levels.
Uses of pivot points
A pivot point can be used for the following purposes:
1. Determine market trends
Depending on the direction of price movement, pivot points can be used to determine market trends. It shows a bearish market when the price stays below the pivot level or drops below it. However, a market that remains above or crosses above its pivot indicates that it is bullish.
2. Enter and exit the market
As well as deciding when to enter and exit the market using the pivot point system, traders can also use it to decide when to buy and sell. Trades can be halted at any support and resistance levels identified by the trader.

Bottom line
Some traders may find pivot points helpful, while others may not. They are based on a simple calculation. Price levels created by the chart are not guaranteed to be reached, reversed, or stopped. Sometimes, a level will be crossed over and over again. An indicator should always accompany a trading plan.

