Do you you can successfully trade with the naked charts? Yes, this is possible if you have sound grip on candlestick pattern. There are several candlestick patterns but you should know few to trade successfully. This article focuses on two of the most popular reversal candlestick patterns, Hammer and Hanging Man.
What are Hammer and Hanging Man Patterns?
Both of them are candle formations. They have long lower wicks and small real bodies. The pattern usually forms at the top of a day trading range or very close to it.
As the name suggests, the hammer is a hammer-shaped candlestick at the bottom of a downtrend. This pattern forms when the price of an asset stops dropping.
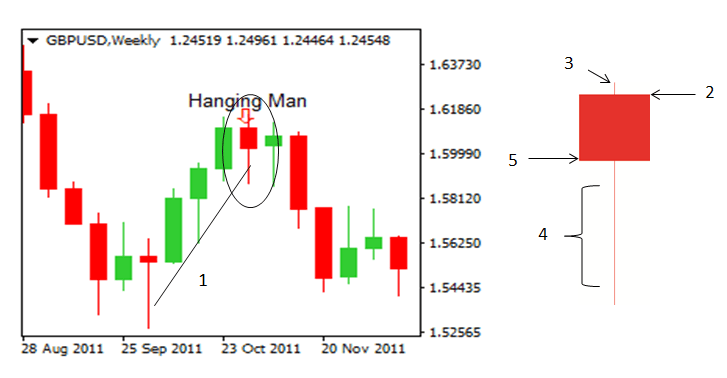
Hanging Man forms at the top of an uptrend and predicts an expected reversal. It has a long lower wick, a short real body and a small upper wick.
When does the pattern occur?
The pattern forms when the following conditions are met.
- You can see a candle forming with a short body near the upper boundary of a trading range.
- The lower wick of the candle is 2-3 times longer than its real body.
- The candle has a small or no upper wick at all.
How does the hammer pattern form?
The hammer pattern forms in a bear-dominated market. A trading session opens with a price increase. Then the price goes high enough to become the day’s high.
It is unlikely for the price to go any higher than that; hence the selling power starts fading away. But, on the other hand, if the closing price is higher than the opening one, the situation favors the buyers. Resultantly, the next trading day is initiated with higher opening and closing prices.
How does the hanging man pattern form?
This pattern is found in a bullish market. When the price goes lower than the opening price of that trade and then rises to a high, the Hanging Man pattern is formed.
A long lower wick of the candle represents how low a price can go. Therefore, if a candle after the Hanging Man opens at a lower level, it is high time for traders to sell.
Signs that strengthen the signals generated by both patterns:
Following are the signs that strengthen the signals given by Hammer and Hanging Man formations:
- Very long lower wick
- Short to no upper wick at all
- Extremely short real body
- Strong trend and the color of the body
The color tells a lot about the strength of the pattern. For example, a hammer with a white body represents strong bullish powers compared to a black body.
The lower wick should be twice as long as the real body but not more than three times. The length of the upper wick must be 5-10% of the candle range.
The bottom of the hammer pattern should be below the trend, whereas for a hangman pattern, the bottom must be above the trend.

