A flag pattern is. In fact, in the shape of a candlestick. It is a popular trading pattern that depicts the continuation of an underlying trend.
This pattern gives us insight despite a big move already occurring.
A flag pattern is formed after a sharp move and has a rectangular “consolidation” that gives it the same look like a flag on a pole.
Moving ahead, we will discuss how to identify a flag pattern in forex and then move on to bullish and bearish patterns.

What is a Flag Pattern?
The flag pattern is reliable and continuous. It also allows us to make straightforward decisions about profit and stop-loss.
A flag pattern is traded in the direction of the ongoing trend.
As mentioned earlier, a flag pattern has a flag and a pole.
After the initial fluctuation of the price, the pole forms first – rise or fall.
Next comes the period of consolidation, where the body of the flag is formed.
How do we identify a Flag Pattern?
We know that flag patterns are continuous. So, to identify one, you need to see if you are in a trend or a consolidation.
A bullish trend has prominent higher highs and higher lows. On the other hand, a bearish trend has lower highs and lows.
As a rule of thumb, keep track of higher time frames, like 4-hour or daily frames. This will allow you to gauge the present market state immediately.
A flag can easily be spotted when there are bursts in prices. Thus, this is precisely what you should look for.
The bursts will appear as many candles, which are average-sized and all of the same color.
The following consolidation, representing the body of the flag, forms five to twenty candlesticks.
The consolidation is formed by profit-taking in the beginning. After that, a tighter consolidation performs better.
Bullish and Bearish Flag Patterns
For a bullish trend example, we have higher highs and higher lows.
A strong bullish pull upwards will cause the price to rise over 50 pips and make a new high. However, a tight consolidation will occur after this, creating the look of a flag.
When the upper trend line breaks, long trade then occurs. Soon, another price rise will occur by 50 pips, hitting our profit.
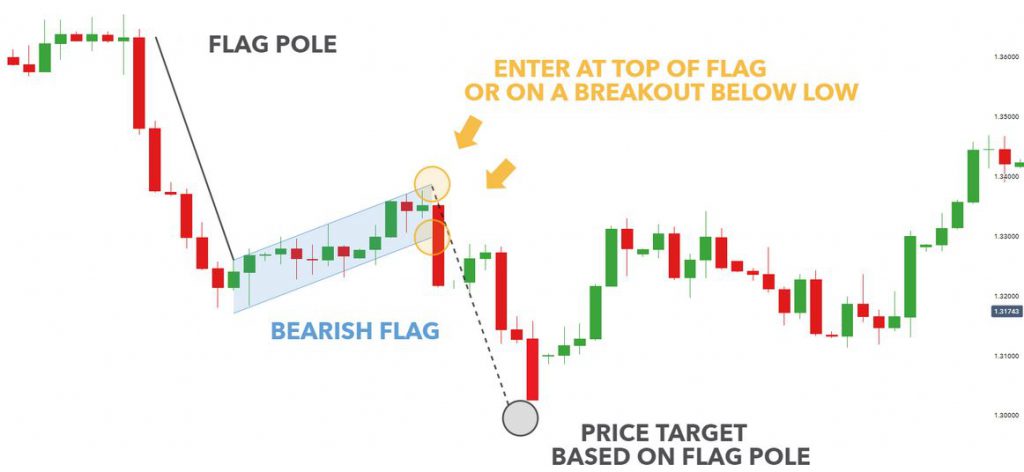
There are clear lower highs and lower lows for a bearish flag pattern.
Trading Flag Patterns
All time frames can have flag patterns. It is easy to spot them on charts because of the sharp rallies or steep declines.
Measure the height of the flag pole and then add it to the breakpoint of the flag. On the other side of the flag, the stop-loss level is present, just beyond the last data point of the price.

Bottom Line
We must know how to identify flag patterns – I.e., with their characteristic pole and flag. It is also vital to know the bullish and bearish trends and how the prices move during such patterns.

