Trend trading is among the most popular forms of trading. With the super trend trading system, short-term trends are exploited to ride and get on board for price moves.
What is a super trend indicator?
The super trend indicator created by Olivier Seban is supposed to work on different timeframes. It works for forex, equities, and futures and is used in hourly, weekly, and daily charts. This indicator uses 10 periods for the average true range and 3 for multiplier as default values. Here the number of days is represented by the average true range, and on the other hand, the multiplier gives the value by which the range is multiplied.
Super trend trading system indicators and settings
Our super trend trading strategy uses three indicators, and one of them helps us determine where our stop loss should be placed on the trade.
Super trend indicator: settings of a multiplier of 1.5 and period 8
Simple moving average: 200 period
Average true range: used to measure volatility, and it uses 14 periods and 1.5X for the risks.
Time frame: 4 hours and up
Current pair: can be any
How to use super trend Indicator?
We need to follow these steps to use this super trend indicator:
- Open the chart of a specific stock that you want to trade.
- Then you have to fix 10 minutes for intraday trading. You can do this by using any good charting software.
- Insert this super trend is your indicator.
- When the signal is in your favor, start tracking.
- To buy and sell the assets, you can follow the arrows for the signals.
We can easily analyze the assets by using this super trend. Moreover, it provides signals to go for long or short on confirmation of the trend.
Super trend indicator formula and trading strategy
The super trend indicator is a wonderful tool to know the market trends. It clarifies the distinction between uptrends and downtrends.
Calculation of super trend indicator
Down= (high + low / 2 – Multiplier x ATR)
Up= 9 high + low / 2 + multiplier x ATR)
Calculation of Average true range
[(prior ATR x 13) + current TR] /14
Here, 14 represents a period. So, the average true range can be derived by multiplying the previous average true range by 13. Then add the latest true range and divide it by period.
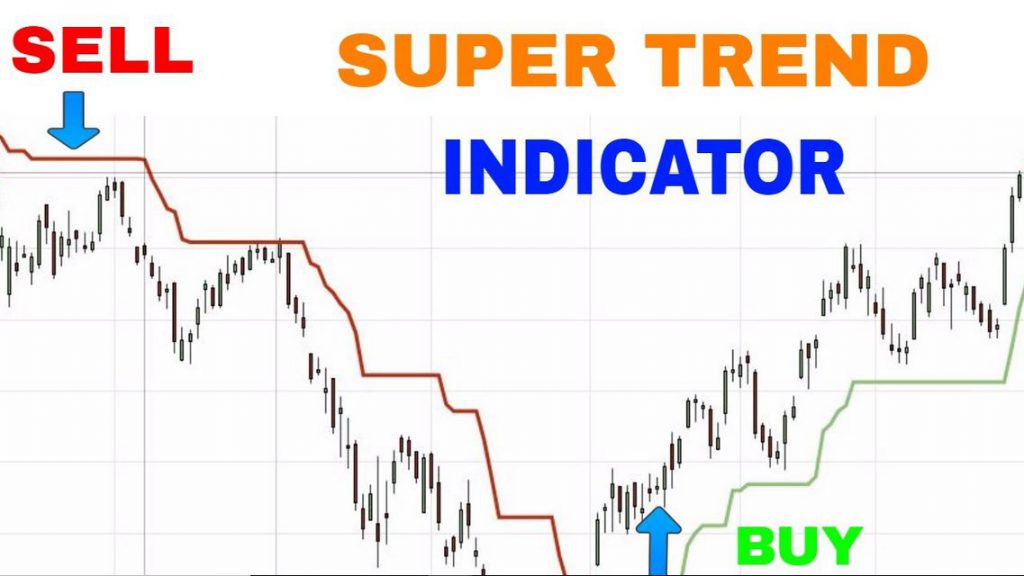
Identifying buy and sell signals
The main crux for intraday traders is understanding and identifying buying and selling signals. The flipping of the indicator on the closing point indicates signals. For example, green will represent a buying signal while the sell signal will indicate by red. A sell signal will occur when it closes above the price.
Bottom line
The good thing about the super trend indicator strategy is that it sends out accurate signals at a precise time, and it is accessible on various platforms free of cost. It also offers the quickest technical analysis to enable intraday traders to make more good decisions.

