Non-banded oscillators are known as ROC indicators. An indicator shows if a trend has accelerated, slowed, or remained the same.
Discover the ROC trading strategy, which is yet another momentum-based strategy. In ROC trading, two concepts are employed: studying the strength of the trend and the possibility of a change in momentum.
After reading this stock trading guide, you will know how to trade stocks using ROC trading rules.

What is the price rate of change (ROC) indicator?
A rate of change indicator measures the rate at which a price changes over a defined period, representing a momentum oscillator. The rate of change (ROC) analysis calculates the percentage change between the most recent price and the price of “n” periods.
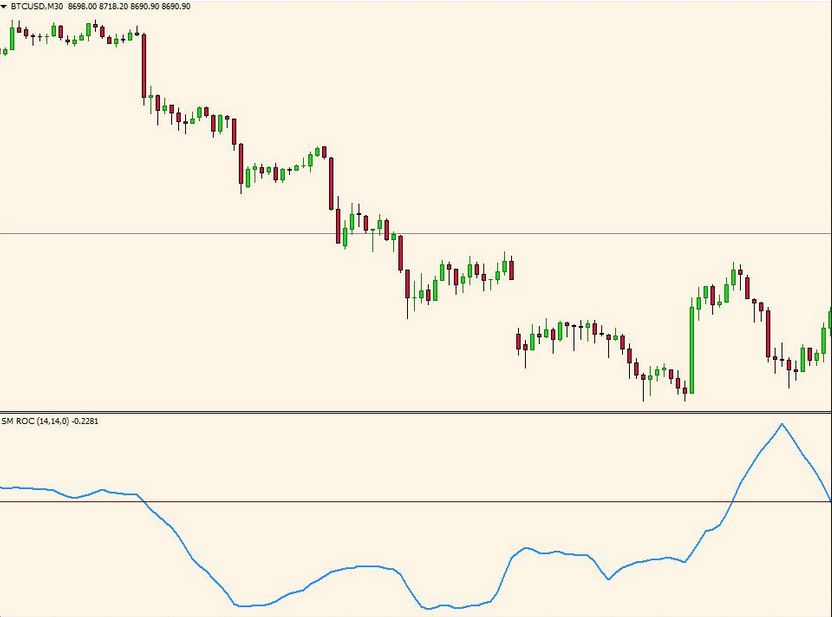
Above and below the zero line, an oscillator is formed as the rate of change shifts from positive to negative.
Calculation of ROC indicator
- This indicator measures a 2-period closing price relationship.
- A standard calculation takes 12 days into account.
- The company’s price is subtracted from its current price based on the closing price 12 days ago.
- A plot, or ROC chart is used to visualize the difference.
- In some cases, it is a positive number, while in others it is a negative number.
- ROC = [(Close – Close n periods ago) / (Close n periods ago)] * 100
- Therefore, a zero line is plotted as a central reference line.
Based on the speed at which a variable changes over a specified time, traders use the rate of change to interpret whether the price rises or falls.
The current price rate and the ROC usually move in tandem for most parts. For a better insight into the current trend, traders look at the rate of change when the current price and ROC move in opposite directions.
Trading rules and interpretation
- If ROC rises above zero and continues, the trend is not only up but also accelerating.
- As the Rate of Change falls but remains above zero, the uptrend lags.
- The rate of change is significantly increased when it crosses the previous top and rises above zero again, indicating the uptrend is very much on track.
- An increasing rate of change under zero indicates that a downward trend is gaining momentum.
- An upward trend in the Rate of Change indicates a slower downtrend speed when it is below zero.
- A rate of change below zero indicates another acceleration in the downtrend.
Limitations of ROC
With the ROC indicator, the most recent price is given equal weight to the price from n periods ago, yet the future price movement is more important. There is also the possibility of whipsaws in the indicator, especially at the zero line.
Divergences in ROC can sometimes give false signals, so traders must confirm their trades if they find that other indicators or analysis methods suggest a reversal is imminent.

Bottom line
In ROC, the trend speed is measured in acceleration, slow down, or maintenance. In the case of a rising but falling rate of change, it indicates that the rising process is slowing down.
In the case of a rising Rate of Change, which crosses the previous peak, it indicates that the uptrend is very much in motion. The Rate of Change (ROC) strategy states that when the Rate of Change goes above zero from below, it indicates that it is going in the right direction. ROC can also be used to forecast turning points and identify extremes by a few traders.

