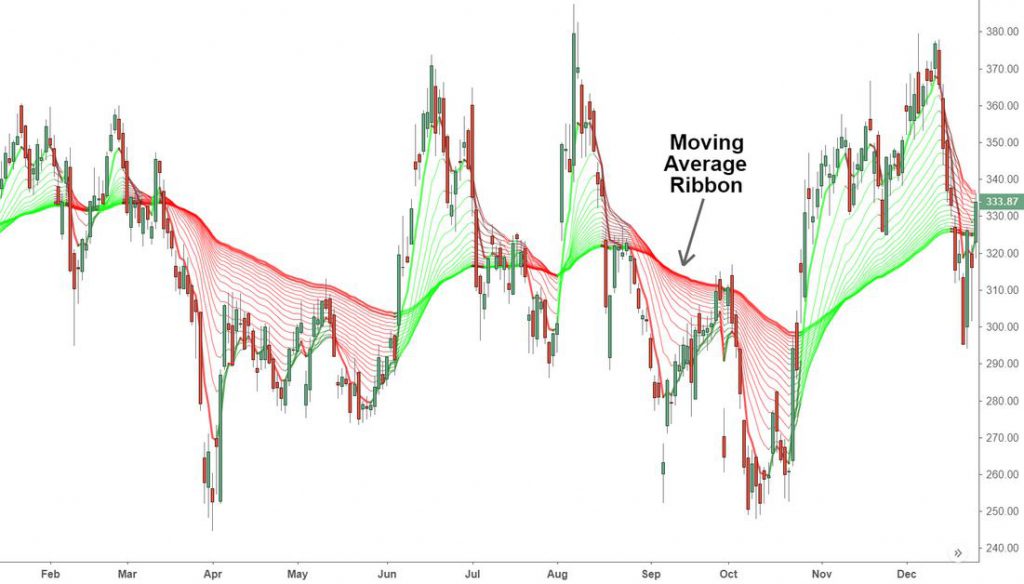
The moving average ribbon plots different moving averages and creates a ribbon-like structure. The spacing between the moving averages gauges the trend’s strength, and the price in relation to the ribbon can be used to identify key levels of support or resistance.
Understanding moving average ribbon
Moving average ribbons are typically made up of six to eight various length moving averages. However, some traders may choose for less or more.
Moving averages have different periods, although they are commonly between 6 and 16.
The indicator’s responsiveness may be changed by adjusting the periods utilized in the moving averages or adjusting it from a simple moving average (SMA) to an exponential moving average (EMA).
The shorter the periods utilized to calculate the averages, the more sensitive the ribbon is to price fluctuations.
For example, a series of 6, 16, 26, 36, and 46-period moving averages will react faster to short-term price fluctuations than 200, 210, 220, 230-period moving averages. The latter is favorable if you are a long-term trader.
Moving average ribbon trading strategy
It helps to confirm a rising price trend when the price is above the ribbon, or at least above most of the MAs. An upward-angled MA can also help confirm an uptrend.
It helps to confirm price dip when the price is below the MAs, or most of them, and the MAs are inclined downwards.
You may change the indicator’s settings to show support and resistance levels.
You may change the MAs’ lookback periods such that the bottom of the ribbon, for example, has previously offered support to a rising price trend. The ribbon may be used as a support in the future. Downtrends and resistance are treated in the same way.
When the ribbon expands, it indicates that the trend is developing. The MAs will broaden out during a big price rise, for example, when the shorter MAs draw away from the longer-period MAs.
When the ribbon contracts, it means the price has reached a point of consolidation or decline.
When the ribbons cross, this may signify a shift in the trend. For example, some traders wait for all of the ribbons to cross before taking action, while others may only require a few MAs to cross before taking action.
The end of a trend is signaled by the moving averages broadening and separating, commonly known as ribbon expansion.
Also, when the moving average ribbons are parallel and equally spaced, it indicates a strong current trend.
Drawback of the strategy
While ribbon contraction, crosses, and expansion can help measure trend strength, pullbacks, and reversals, MAs are always lagging indicators. This means that the price may have shifted considerably before the ribbon indicates a price change.
The more MAs on a chart, the more difficult it is to figure out which ones are important.
Bottom line
Moving average ribbon strategy is good for determining the trend’s direction, pullbacks and reversals. You can also combine it with other indicators like the RSI or MACD for further confirmation.