When you need to sell foreign currency, you hear a lot about Forex deposits. The term “retracement” is frequently used when discussing Fibonacci retracement forex. However, this is only sometimes the case.
What is the definition of “forex retracement”?
Any temporary reversal of an on-going price trend is known as a pullback. The phrase “inside” is crucial. This is what separates a reversal from a comeback.
This shift signals the end of the price trend and the beginning of a new phase of stability. The withdrawal period is temporary.

Methods for determining Fibonacci retracement levels
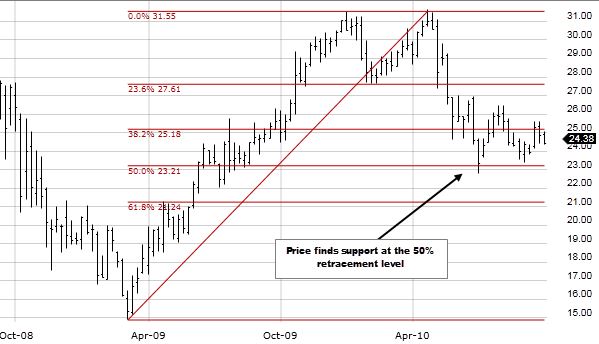
The Fibonacci retracement level is not represented in any mathematical framework. The user selects two places on a graph where these symbols have been placed. Once you select two points, the lines are calculated from the distance that separates them.
Let’s say there’s a $5 increase to $15. The retracement symbol is drawn between these two prices. If we take $ 15 and subtract $5 (multiplied by 0.236), we get $ 13.82, an increase of 23.6%. $12.5 is the fractional portion ($15 minus ($5 x 0.5) = $12.5).
How to calculate a Fibonacci retracement level?
It has already been established that the Fibonacci regression levels cannot be used for precise counting purposes. These are merely a percentage of the selected price bands.
But discovering their historical context is fascinating. They are based on the golden ratio. Put a 0 and a 1 at the beginning of the sequence.
Thus, the result is an infinite series of numbers obtained by adding the first two digits together, beginning with 0 and ending with 987.
This sequence of numbers forms the basis for all Fibonacci retracement levels. The result of a division by two numbers is 0.618, or 61.8%. Dividing the left-hand figure by the right-hand figure yields 0.382, or 38.2%.
Mathematical computations using this sequence of numbers underpin all ratios except for 50%, which is not a Fibonacci number. The golden ratio, often called the Divine Ratio, is everywhere, from numbers to genes.
The complete 0.618 or 1,618 golden ratios can be found in sunflowers, galaxy structures, shells, ancient artefacts, and structures.

Why are Fibonacci retracements so significant?
In fundamental research, Fibonacci retracement levels are employed as potential turning or stopping points for stocks.
Standard percentages include 23.6, 38.1, and 50. This typically occurs in the middle of a security’s price range, between high and low points.
Bottom line
Find out where to look for downloads you can use in your foreign exchange trading. Their usefulness is not contingent on their being at a Fibonacci level, although returning to a Fibonacci level is always amplified by a factor of two.
Select the appropriate tool in your graphics application to make a Fibonacci retracement level and enter the appropriate values. Please select the most recent peak (or trough) and connect it to the following gyration. The Fibonacci proportion is computed and displayed instantly.


