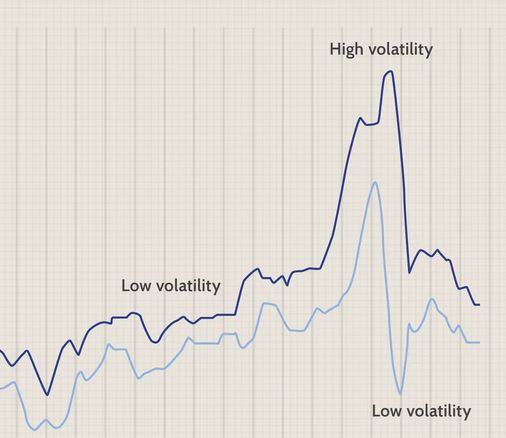
The Average True Range (ATR) indicator is often used in investing for several reasons. The ATR could help your trend trading, show you how the market works, and help you set targets more accurately to increase your chances of success.
What is the purpose of using ATR?
Market experts might use the ATR to help them decide when to start and leave a trade. It was made so that investors could use simple mathematics to measure the daily volatility of an object more accurately.

This indicator doesn’t show anything about how prices will change. Instead, it determines how volatile gaps are and limits vertical and horizontal moves. The ATR can be found quickly by looking at past prices.
Thus, the ATR can also be used to determine the size of a deal on the derivatives market. The ATR method can determine a trader’s position size by considering their risk tolerance and the market’s volatility.
How to use ATR for day trading?
When used with one- or five-minute charts for intraday time frames, the ATR will jump when the market opens. The first minute after the big markets like London or New York open.
The average true range (ATR) increases the most in the East. That’s because volatility is strongest in the morning, and all the ATR shows that things are more volatile now than the night before.
After going up in the morning, the ATR usually goes down during the rest of the day. During the day, the average true range (ATR) tells us how much the price changes every minute.
Investors use the daily ATR to measure how much the price of an object changes during the trading day. Day traders can do the same thing with the one-minute ATR. You could use this technique to set take-profit or stop-loss levels.
How much of the average true range is best?
When using an ATR gauge, most people choose the number 14, which is 14 days. However, there are a few other beneficial choices as well.
Using a smaller number, which means a shorter time, draws attention to how dangerous things are. Potential buyers interested in buying for a long time may benefit from a complete number.
How should a good ATR look?
Depending on the object, different ways exist to find the best ATR. If its real range on average is around $1.18, it is acting normally.

Well, if the ATR for a certain good is more than $1.18, it may mean that more research needs to be done. Also, if the ATR is much smaller than usual, you should first figure out why this is happening.
Bottom line
The average true range of an item’s prices shows its volatility. It’s not meant to find trends; instead, it measures how much prices change over a certain amount of time. All you need to figure out ATR is the price data of a security over the period you’re interested in.


