Ichimoku Kinko Hyo, also known as equilibrium chart, has 5 indicators similar to the moving average. This chart was developed by the Japanese journalist Goichi Hosoda in the 1930s and finally released to the public in the 1960s.
To develop this trading system, Hosoda hired a team of 7 people to make the calculations. He and his team spent years developing the system. After developing the system, he kept it a secret for decades until he finally released in 1968 seven books with all his knowledge about the Ichimoku.
The purpose of the trading system is in the name. It just is in Japanese.
Ichimoku: One Look, glance
Kinko: Balance, equilibrium
Hyo: Chart, graph
So, the development of the system had the purpose of following the trends and predicting possible resistances and support levels quickly, at a glance.
How is Ichimoku built?
The Ichimoku chart is made out of 5 elements. These elements are just moving averages with 9, 26, and 52 periods. The number of periods responds to the particularities of the market for which the Ichimoku chart was designed. For example, the Japanese stock markets worked 6 days a week (around 26 days per month), 52 weeks per year. He never said the reason why he used the 9 periods. What makes Ichimoku’s chart different are the displacements of these moving averages.
The 5 components of Ichimoku are:
- Tenkam: This is the average of the highs and lows of the previous 9 periods.
- Kijun: Is the average of the highs and lows of the previous 26 periods
- Senkou Span A: This line is the average of Tenkam and Kijun and then displaced 26 periods
- Senkou Span B: It’s the average of the last 52 periods plotted 26 periods ahead
- Chikuo: This is the closing price plotted 52 periods behind.
How to trade Ichimoku?
Traders use Ichimoku in different ways. Its 5 elements can be combined according to the trader’s preferences. The way of using the strategy depends on the signal that the chart gives us. There are 3 types of signals that the Ichimoku chart gives us, those signal are:
- Resistance and support zones
- Trends
- Turning points
Resistance and support zones
We are probably in front of a Support or resistance zone:
- When the price hits Tenkam
- When the price hits Kijun
- When facing the Cloud. The Cloud is always acting as a support or resistance zone
- When the price hits Chikou or when the Chikuo hits any other elements of the chart.
Trends
The chart elements are always acting as support or resistance levels. So, the trend is always trying to fit into the elements.
For instance, for a bullish trend, the price should be above the Tenkam, Kinjum, and the Cloud. But below the Chikuo.
Turning points
The width of the Cloud is a good indicator of the continuity or discontinuity of the trend. A thinner Cloud often indicates the possibility of a reversal.
Strategies
The most important element of the chart is the Cloud. Some traders even use the Cloud alone to trade. Let’s see 3 ways in which you can combine the elements of the Ichimoku chart to trade.
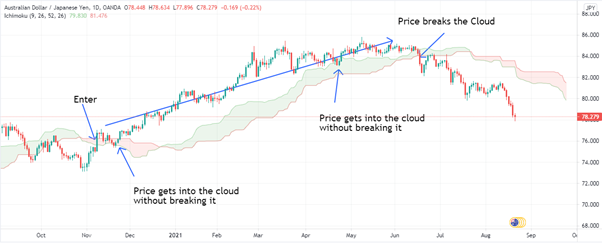
Cloud- Kijun
With this strategy, the trader will enter the position when the price breaks the Cloud to catch the trend and stay in the trade until the price breaks the Kijun line.

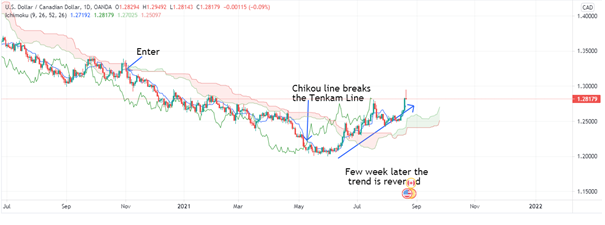
Cloud-Chikou-Tenkam
In this strategy, the trader will enter the market once the price breaks the Cloud and exit it when the Chikou line breaks the Tenkam Line.
Cloud
Finally, the third strategy depends on the Cloud alone. Therefore, the trader should only enter and exit the trade according to the Cloud. In this way, the trader enters the trade when the price breaks the Cloud the first time and then exits the trade when the price breaks the Cloud against the trend.
Bottom line
The Ichimoku chart looks like a complicated set of lines hard to understand, but once you study it, it is clear that this is not true but is the exact opposite since the chart was developed to read the market “at a glance”.
Ichimoku’s innovation is on the displacements of its particular moving averages. Thus, the Ichimoku Strategy can be used to find resistance and support zones, but its stronger signals are to follow trends.

