Crab patterns are harmonic patterns that traders use to trade in the financial markets. The crab pattern works similarly to other harmonic patterns as it has a solid record of profitability in backtesting. Let’s look at the Crab pattern strategy in this article and how you can reap the benefits of trading with this trading tool.
What is the crab pattern in Forex?
Crab patterns are harmonic patterns similar to Butterfly and Gartley patterns. They can serve as a reversal indicator. As a result, it forms at the top of the price range or the bottom of the price range, and it signifies a market reversal. There are four legs like in other patterns- XA, AB, BC, and CD. X is the starting point, and D is the finishing point.
Identify the crab pattern in the Forex charts
Patterns like the crab are formed with price movements based on Fibonacci calculations, also harmonic patterns.
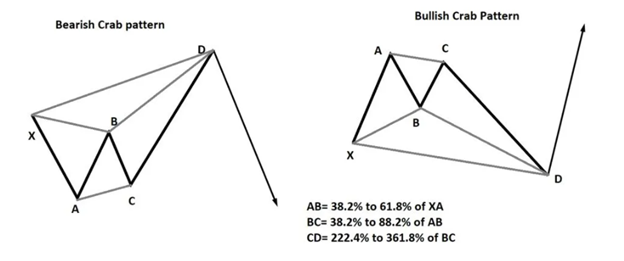
In the following example, let’s see what the legs of a crab pattern mean:
- – XA: Crab patterns have a first leg known as XA. XA refers to the primary counter-trend wave in a Crab pattern. This leg lacks Fibonacci calculations, but it is critical since other calculations rely on it.
- – AB: AB forms when the XA leg is calculated by using Fibonacci. A Fibonacci retracement of XA can be found at point B between 38.2% and 61.8%.
- – BC: The BC leg is dependent upon the AB leg. The retracement of AB can range between 38.2% and 88.6%. Therefore, the Crab pattern will remain valid until point A does not break above or below point B.
- – CD: A crab pattern is completed with a CD leg, which is the longest leg. The CD leg can be moved from 224.0% to 361.8% Fibonacci extension level.
Fibonacci ratios are integrated into the crab pattern, as shown in the following image.
Bearish crab pattern trading strategy
To identify point D, locate the XA leg after a bullish market and match it with Fibonacci retracement and correction. We can see below how a bearish crab pattern forms following a bullish trend and calculating.

- – Entry: You need to identify point D before you wait for a reversal candlestick to appear. Once the reversal candlestick has closed, it is time to enter this trade.
- – Stop-loss: The highest point in the stop-loss chart is D. Make sure to set your stop loss above point D. Consequently, ensure you have a buffer to eliminate short-term market noise.
- – Take profit: The perfect take profit zone is A. Nevertheless, you can close a part of your trade when the price reaches point B and move your stop loss at breakeven to close the remaining part of your trade.
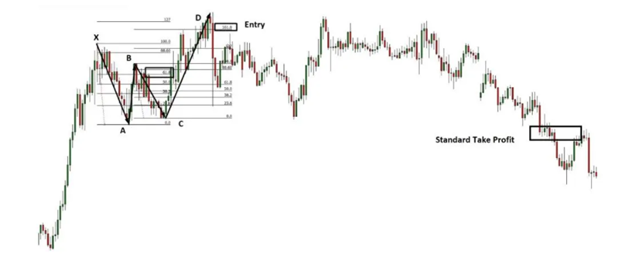
You can find an illustration of setting the profit level and stopping loss level in the above image.
Bottom line
Let’s sum up the Crab pattern strategy:
- – A crab pattern indicates a market reversal.
- – A point C cannot fall below or surpass a point A.
- – If D breaks below or above point X, a new higher high and lower low should occur. You should use a 15-30 pip stop loss level.
In addition to using the right trade strategy, make sure you reduce your overall trade risk by applying the right money management techniques.

