The “novice” and “intermediate” level traders will always experiment with technical indicator strategies during their early months and years. And they should experiment, as without trader curiosity it’s impossible to gauge what works and more importantly what works for the individual trader. Trading is a highly personalized business, there is no one single method to trade the market successfully, however, what many retail traders discover, mainly through trial and many errors, is the one true trading strategy and overall method that works for them.
It’s far too easy to dismiss the importance and value of technical indicators, and many experienced and by association successful traders, will testify that they needed to involve themselves into a voyage of discovery involving technical indicators, because if they hadn’t then they’d have missed out on a highly valuable process of elimination. They’d have never arrived at a destination of enlightenment, whereby they eventually fully understood many aspects of trading. How can anyone dismiss the effectiveness of technical indicator trading strategies, unless they’ve tried many such strategies over a reasonable period of time and judged their worth?
As is our habit, we need to remind our clients and wider readers of an important issue; we suggest that traders only use these examples on a daily time frame. Most of these indicators were created and thereafter developed before retail internet trading was established. The creators invented them to principally trade commodities on a daily, or weekly time frames. And for novices we’d suggest initially concentrating on developing a daily or swing trading method, perhaps only trading one forex pair initially, such as the most popular EUR/USD.
In this article we’re going to avoid the subjects of back testing and forward testing, we’ll leave that for another day, instead we’ll concentrate on the simple application of choosing some of the most commonly used technical indicators and how we can identify if they might fit in with our trading style and overall trading plan and strategy. We’ll use one from each of the four most commonly referred to groups, which are:
• a trend following tool,
• a trend confirmation tool,
• an overbought/oversold tool,
• a profit taking tool.
We’ve selected these groups as selecting a technical indicator from each group and overlapping each onto a time frame, could provide a highly effective four technical indicator trading strategy. In this article we’ll only discuss the merits of each in identifying a potential use. In our follow on article we’ll discuss how to potentially link each one (from the four sets) together, in order to compile an effective strategy.
A trend following tool might be the simple mechanism of a moving average crossover. This really couldn’t be simpler to identify on a time frame; we may have two moving average lines, one a fast moving indicator/line and one a slow moving indicator/line, when they cross we either go long, or go short, we either buy or sell. If we attach some basic risk to the strategy then we have the basis of a plan.
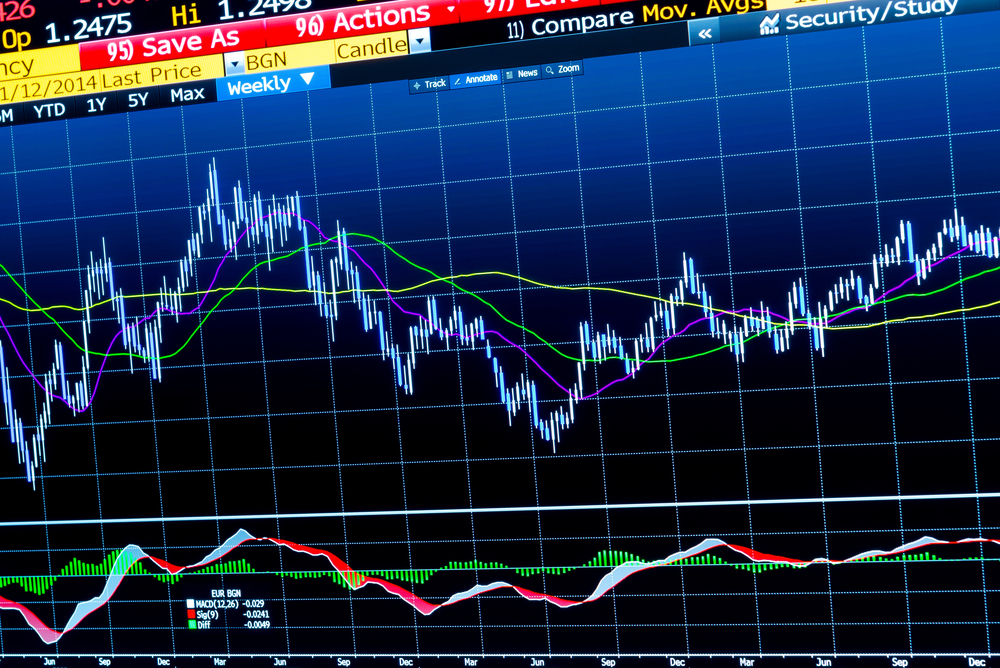
A trend confirmation may be the MACD, one of the most popular visual tools traders use. The MACD typically is demonstrated by a basic histogram and two/three moving averages, we can clearly see peaks and troughs. When it peaks and turns we may sell, when we witness a trough and turn in sentiment, we may buy.
An overbought/oversold tool can be illustrated by the RSI. An excellent tool that (in theory) reveals that our market for a security, perhaps our EUR/USD, is either over bought, or oversold. Overbought? We close our existing long trade and tend go short. Oversold? We reverse the process.
Bollinger bands are considered by many traders to be an excellent profit taking indicator. Again the bands are highly visual and easily identifiable on any chart and time frame. Upper band being breached could indicate a time to close out a long trade, whereas the lower band being breached provides a trigger to close a short trade.
So now we’ve identified the four main groups of trading indicators, the next stage would be to embark on combining these four distinct indicators from the sets and using the specific examples we’ve highlighted, into a useful trading strategy and method and then testing it.

