There are many Japanese candlestick purists who will dismiss Heikin-Ashi candles as being; too simplistic, misleading and in some cases amateurish. The most common complaint is that HA lags in a direct comparison with Japanese candles and that lag causes late entry when looking for price action. The counter argument would be that similar to all other indicators HA should be used in conjunction with other charting methods and used correctly (within the parameters of its intended use) to ensure traders are getting the best out of the indicator.
It’s worth dwelling on that main criticism for a moment, the supposed lagging issue. Whilst undoubtedly there’s some merit in that highlighted ‘fault’ HA often encourages the trader to stay with the trend to the end, and whilst the lagging price action criticism is valid, once entered the trade by using HA the trend is more often than not likely to be present and not false. Other phenomena are less likely using HA, for example, whipsaws given that HA is one of the finest tools available for filtering out market noise. HA is one of the clearest mechanisms for showing trends and reversal available. Similar to the Ichimoku charts, the Heikin Ashi was a relatively unknown trading tool and price indicator that has recently enjoyed a rise in popularity, despite being accessible since its introduction some two decades previous. That increased awareness and popularity may be due to the prevalence of the HA option on many charting packages.
Unlike regular Japanese candles, Heiken-ashi doesn’t define the: open, high, low and close on each candle. Instead values are calculated for each candlestick based on the dominant forces in the market using averages. For example, if sellers are clearly dominating, Heiken-ashi candlesticks will be bearish, even if the price bar closes higher than it opened. These Heiken-ashi candles are arguably the perfect tool for traders who like following trends to their full extent. Heikin-ashi’s look of simplicity makes trends easier to recognise and as a consequence in many instances far easier to make decisions from.
Experienced retail traders accept that the majority of their profits are generated when markets are trending, predicting trends correctly is therefore crucial. Many traders use candlestick charts to help them locate such trends amid erratic market volatility, the ability of HA to filter out noise is one of its huge advantages over and above other price indicators. The Heikin-Ashi technique, meaning “average bar” in Japanese, undoubtedly helps improve the isolation of trends.
There are several simple formations with HA that provide signals, help to identify trends and therefore trading opportunities:
- Hollow candles with no lower shadows indicate a strong uptrend. Hollow candles signify an uptrend
- One candle with a small body, surrounded by upper and lower shadows, is a strong indication of a possible trend change
- Filled candles indicate a downtrend
- Filled candles with no higher shadows identify a strong downtrend
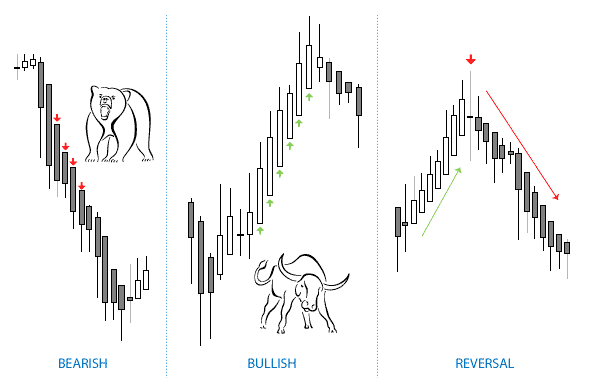
These easy to spot examples of easily identifiable candle formations and signals illustrate that identifying trends and trading opportunities can be far simpler with HA. The trends are not frequently interrupted by false signals and as a consequence are easier to identify. Using these simple single candle formations for the three main market events we look for in order to thrive as traders is very straightforward; bullish, bearish and reversal conditions are covered here.
Spotting Bullish Candles
When the market is bullish, Heikin-Ashi candles have larger bodies and long upper shadows but no lower shadow, examples will demonstrate this. Almost all of the candles have big bodies, long upper shadows and no lower shadow.
Spotting Bearish Candles
When the market is Bearish, Heikin-Ashi candles have big bodies and long lower shadows but no upper shadow, examples will demonstrate this. Almost all of the candles have big bodies, long lower shadows and no upper shadow.
Reversal Candles
Reversal candles in the Heikin-Ashi charts look like Doji candlesticks. They have no or very small bodies, but long upper and lower shadows.
Heikin-Ashi is suitable for trading all currency pairs, many traders find volatile pairs such as GBPJPY and EURJPY far easier to trade using HA. It can prove to be an extremely reliable indicator for intraday trading and scalping across the lower time frames such as: 15min, 5min and 1min. However, it’s main benefits can be best derived from looking to trade trends across the higher time frames such as daily and 2-4 hours. Heikin-Ashi is also a superb trading tool for fledgling traders. Heikin-Ashi can enhance traders’ patience encouraging the take up of good and profitable trade setups given its ability to eliminate market noise.
In addition to showing the relative strength of a trend HA identifies key turning points in price action and reacts in a similar way to a moving average. Incorporating the session activity into a single candlestick (open, close, high and low), HA smooths over erratic fluctuations in the currency markets and eliminates the spikes that may be sparked by volatility or a sudden jump in price, confirmed and committed chartists can often obtain a clearer picture of market activity and can therefore make more informed trading decisions.
Heikin Ashi is smoother because instead of using a simple low and high of the session to calculate individual candles, the Heikin Ashi takes the prices per bar and averages them to create a “smoother” session. This is fundamental to its successful use as the currency markets in particular tend to provide more volatility and market noise than in other markets. By using a pre-defined formula in each individual trading session to construct the consecutive candles, the HA chart is far more reflective of the underlying price action;
Heikin Ashi Formula
Close = (Open+High+Low+Close)/4
Open = [Open (previous bar) + Close (previous bar)]/2
High = Max (High,Open,Close)
Low = Min (Low,Open, Close)
With this formula HA is isolating price whilst excluding currency market volatility and noise. The resulting pattern not only gives the trader a more visually appealing perspective but one that can help in identifying the overall trend. With a smoother picture, arguably a more simplified one, traders can improve trading the overall trend by combining the Heikin Ashi with other indicators. As with any other chart application, it’s advisable to discover other indicators that potentially compliment your individual trading style when adding on the HA application. This will help traders to establish the market’s directional bias, help identify clearer entries, support and resistance and offer further confirmation of the trade’s potential to be profitable.
Whilst some traders move from Japanese candle sticks to HA many experienced traders would suggest perfecting a HA technique first. As has been illustrated in this article armed with the ability to consistently identify only four formations and three key market events should give the HA trader enough feedback to make informed and therefore profitable decisions. The HA technique can be adopted fairly quickly in direct comparison to the learning process involved with Japanese candle sticks.


Comments are closed.