Financial markets offer a variety of trading techniques. Technical analysis of chart patterns is one of the most popular trading techniques. In this article, we will explain in detail a golden cross pattern. How do you spot golden cross signals? This article will answer these and many other questions as well.

What Is a Golden Cross?
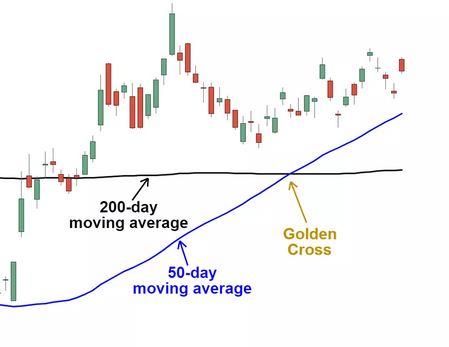
A golden cross pattern occurs when the short-term moving average crosses the long-term moving average from the bottom upward. The 50-day MA determines short-term moving averages, while the 200-day MA calculates long-term moving averages. The period of moving averages, however, depends on the market conditions and trading strategy.
Golden crosses are bullish signals that indicate weakening selling interest. A golden cross pattern consists of three stages:
- The asset trades above its 50-day and 200-day moving averages in a bear market.
- The long-term MA breaks up to the upside as the trend turns upward.
- Upon the intersection of these two lines, a bullish trend begins. The bullish trend continues when the 50-day moving average exceeds the 200-day moving average.
Golden Cross: How Do You Spot It?
Using two simple moving averages, or MAs or SMAs, you can detect the golden cross pattern on the hourly chart or longer-term charts. They show the average price of an asset over time.

EMAs should not be confused with simple moving averages since they focus on the current price trend and react more sharply to recent prices.
Generally, the moving average in a chart is 50 in the short term and 200 in the long term. Periods are used to average market noise, that is, price fluctuations that have occurred in the last few days, and MAs are used to do this. In other words, when the short-term MA is below the long-term MA, it indicates a bearish swing in the short-term price.
It appears as a golden cross. When the 50-day MA crosses the 200-day MA from the bottom up, it is a buy signal.
A golden cross is one of the best buy signals to look for when a bearish trend is in progress. The pattern can be seen at any timeframe but is most accurately displayed in longer-term timeframes such as H4 to D1.
Three Stages of a Golden Cross
Golden cross patterns form in three stages:
- In the first stage, the short-term moving average is below the long-term moving average to detect a long-term downward trend in the price chart.
- Second, the golden cross indicates an increase in price trend. At this moment, the short-term MA 50 crosses the long-term MA 200. An intersection between moving averages indicates the short-term trend is about to reverse upward. You should, however, look for technical analysis patterns that confirm the cross.
- The third stage involves confirming the uptrend is continuing. This stage is crucial since it establishes more profitable trade entry points using other technical indicators and candlestick patterns.
Conclusion
In summary, a golden cross pattern represents a bullish trend reversal. The golden cross indicates a bearish-to-bullish trend reversal and shows a buy entry point when a short-term moving average crosses above a long-term moving average. Despite being a powerful signal, the Golden Cross should be interpreted with other technical indicators.

