The two most compatible and simple-to-use indicators are Moving Average Convergence-Divergence (MACD) and the Stochastic Indicator. In simple words, stochastic compares a stock’s closing price to its price range over time. MACD forms two moving averages that diverge from and converge.
What would happen if the indicators from different systems were combined? Would they cooperate to build a stronger system or oppose one another?
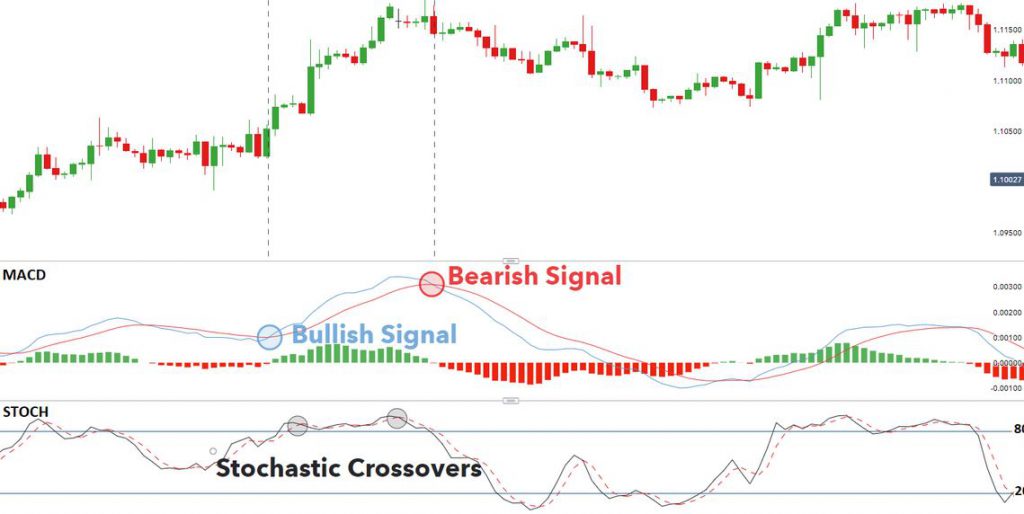
A forex trading strategy can be formed by combining the stochastic forex crossover indicator with the MACD crossover indicator.
Here we will look into how we can get stronger signals by combining these two systems.
What is Stochastic?
The stochastic compares the forex pair’s closing price to its price range over time. The K line indicates the number of periods, while D is the moving average.
When the k line drops below 20, the forex pair is oversold, indicating a buying signal. If the k peak is below 100, the forex pair should be sold before it drops below 80.
The stochastic indicator is widely used in technical analysis. It is simple to use as compared to other indicators. It compares a security’s closing price to a range of its prices over a given time.
What is MACD?
The Moving Average Convergence/Divergence (MACD) indicates price trends and directions. It is a momentum oscillator that is primarily used for trading trends. Even though it is an oscillator, it is not typically used to detect overbought or oversold conditions.
On the chart, it appears as two lines that oscillate without boundaries. The intersection of the two lines generates trading signals similar to a two-moving-average system.
MACD and Stochastic: A Double-Cross Strategy
Stochastic, like MACD, has a faster and slower-moving metric. The double-cross allows the trader to change the intervals, allowing him or her to find optimal and consistent entry points. This allows it to be tailored to the needs of both active traders and investors.
But how can we form a forex trading strategy through this method?
Checking crossovers
During experimentation with both indicators, you will observe crossovers lining differently. You can also add an RSI indicator into the mix.
The histogram and bullish crossover
To begin, look for bullish crossovers that happen within two days of one another. When using the stochastic and MACD double-cross strategy, the crossover should occur below the stochastic’s 50-line to catch a longer price move. And ideally, within two days of placing your trade, the histogram value should be or move higher than zero.
The stochastic crossover should occur shortly before the MACD crossover to use this strategy correctly. Failing to do so could result in a false indication of the price trend or a sideways trend.
Bottom Line
Separately, the two indicators operate under different technical conditions and are self-contained. Together they make an excellent pair and can help you trade more effectively.
However, they are only indicative evidence. So conclusive evidence of effectiveness is not guaranteed. The utility of indicators is dependent on a variety of factors such as time frames, price action, target price, and a variety of other factors.

